Using drone mapping for crop insurance
Crop damage assessments and adjustments have traditionally been difficult to make and are therefore often inaccurate.
Typically, after an insurable event such as a flood, infestation or storm, or even crop damage from wild animals, a measurement of damage for a particular crop is carried out manually. First an insurance loss adjuster must identify all areas in a field that are damaged. Then, in order to measure the area manual tools such as a measuring wheel or tape are used to estimate the area impacted. Finally an assessment of the damage in that area is assigned to calculate economic impact.
Unless a field is very small it simply isn’t possible to see all areas of damage. To properly assess the damage, the field must be walked and measured - if time permits. Obtaining manual measurements can be a major challenge, if not impossible. Many times it entails walking through tall corn on a 100 degree fahrenheit day or walking across a 160 acre field of mud in hip waders.
These struggles to obtain an overview of the farm and ground-based measurements in poor conditions or after a weather event often lead to guess-work or inaccurate reporting. Given these complications it’s obvious how these difficulties can lead to over- or-under payment, valuation disagreements, hold-ups and other complications.
Extreme weather events cause crop loss in Iowa
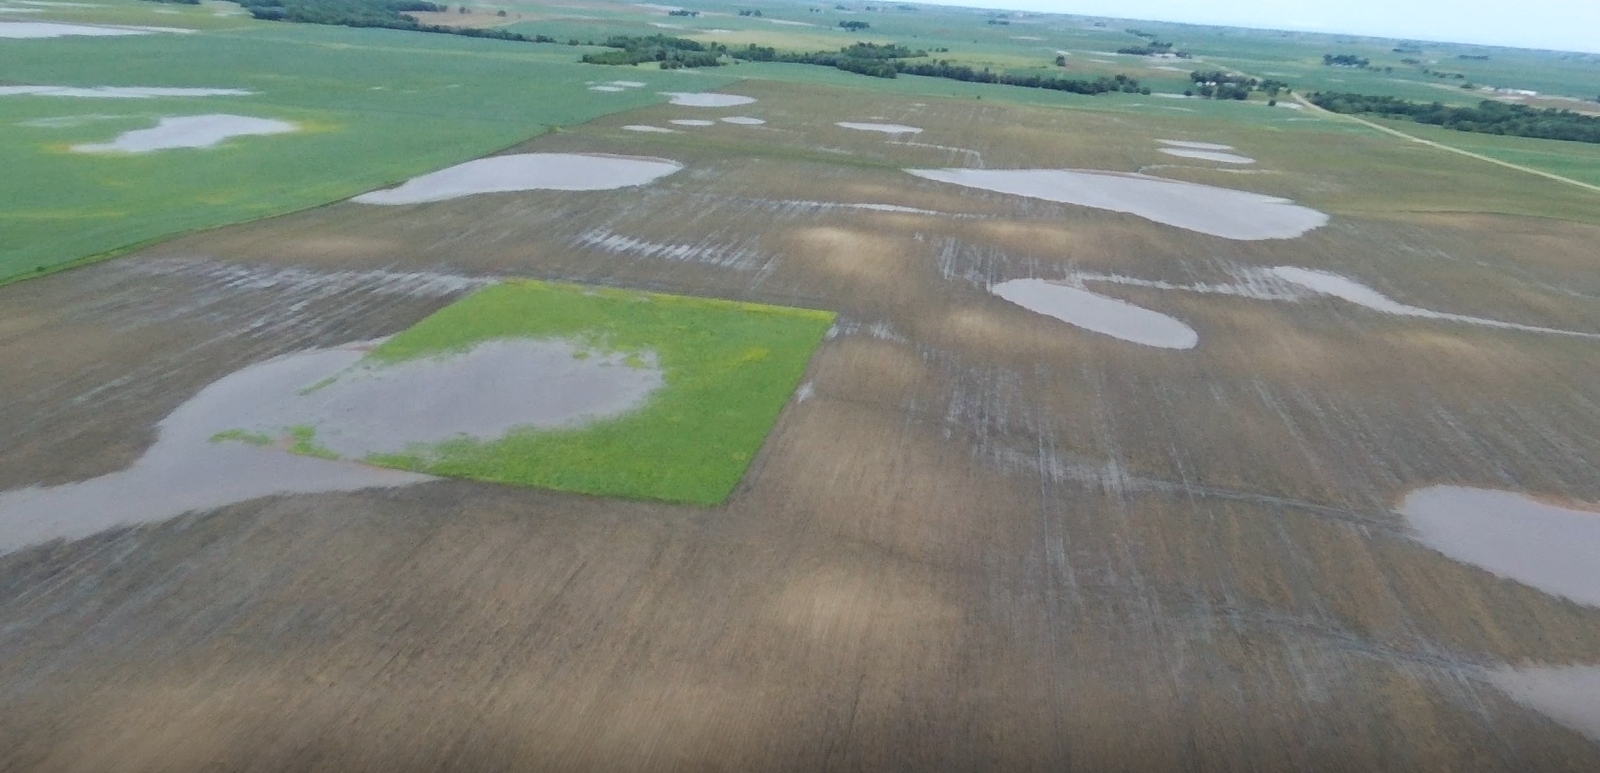
In the Midwest large rain events are common in the summer, saturating the ground which then floods. Drainage is important in Iowa but it is often not sufficient for larger rain storms.
Last summer Iowa farms received record rainfall, having several seven-inch rain storms in a row. Given this large amount of water with no place to go, crops inevitably drown because of lack of oxygen to the roots and sun to their leaves.
Assessing flood damage with the USDA RMA
In the US the insurance industry provides policies backed by the US government and an agency called the USDA RMA. These policies (sold by insurance agents) insure farmers crops to a certain value of production.
When large damaging storms occur, farmers (policyholders) need to file a written notice of damage within a time period (usually 72 hours from the initial discovery) to be eligible for coverage. The written notice of damage or loss initiates a claim procedure and if necessary a third party insurance loss adjuster will come to the farm and inspect the loss, record measurements and submit a claim.¹ This is what ultimately decides if the farmer gets paid or not based on their insurable level.
Usually when a farmer receives a record rainfall in a short period causing a flood, they will contact their agent and start a claim. The agent will file the claim and assign a loss adjuster who then makes an appointment for an on-site visit.
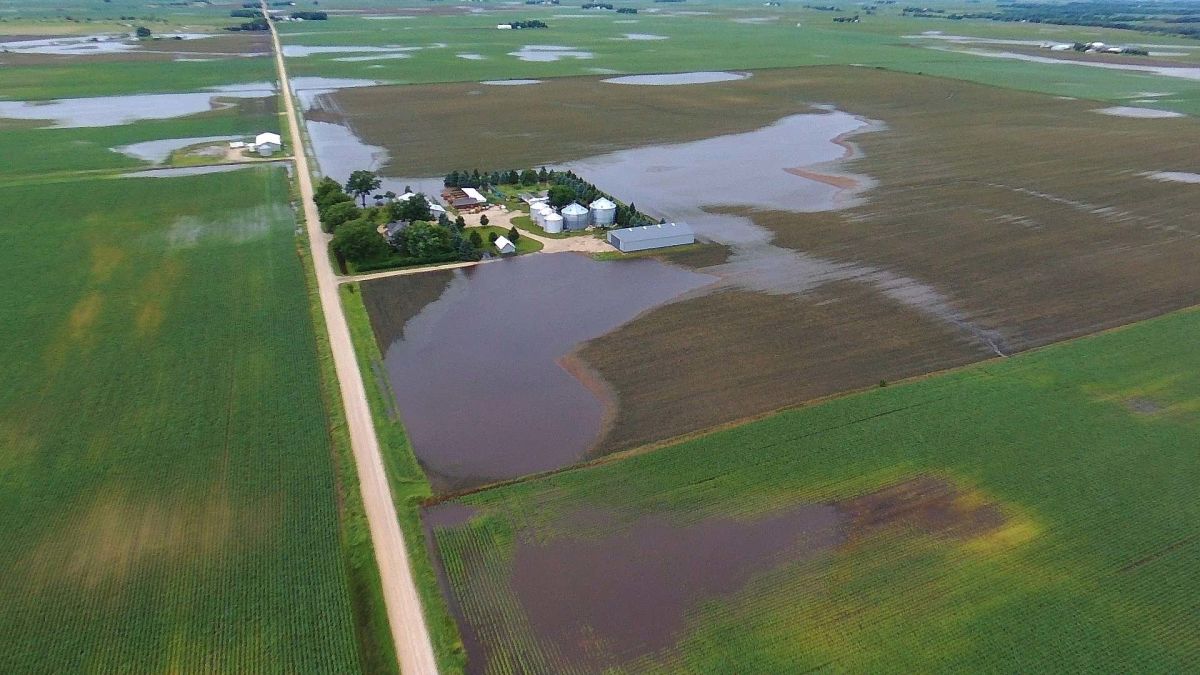
Digital representation of flood aftermath
Once on-site the loss adjuster will fly a drone over the damaged areas and collect the data. In addition to a drone, the loss adjuster can also use Pix4Dfields to process and visualise the data in order to measure the crop loss. These measurement methods fall into the USDA RMA approved measurement methods.² The loss adjuster will create a set of visuals based on which they can then assess the damage and create a PDF report for the farmer with the findings.
With the field boundary feature, the loss adjuster can trim the field to the exact size, to make the assessment even easier. In the image below (generated by the collected data from one of the flooded fields in Iowa) the soil moisture is easy to detect.
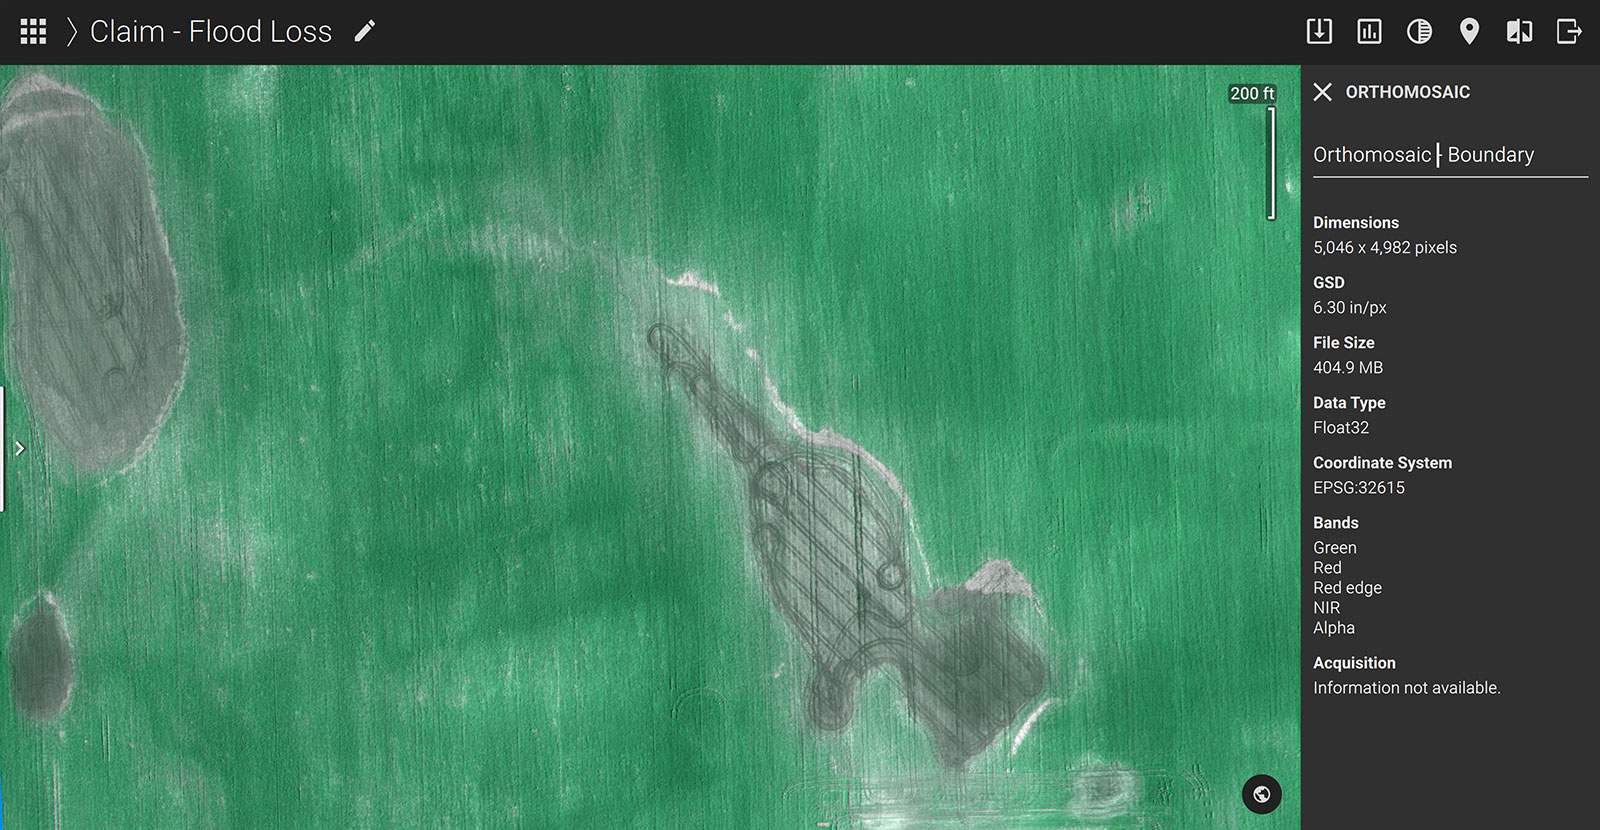
The lighter dryer soils in lines show where drainage tile are drying the soil, the darker soil is wet, and the dark shiny areas are standing water ponds. This is the first step of assessment - digitally representing the state of the flood aftermath in a form of an orthomosaic.
Custom indices for custom results
The next stage is estimating the level of damage and area.
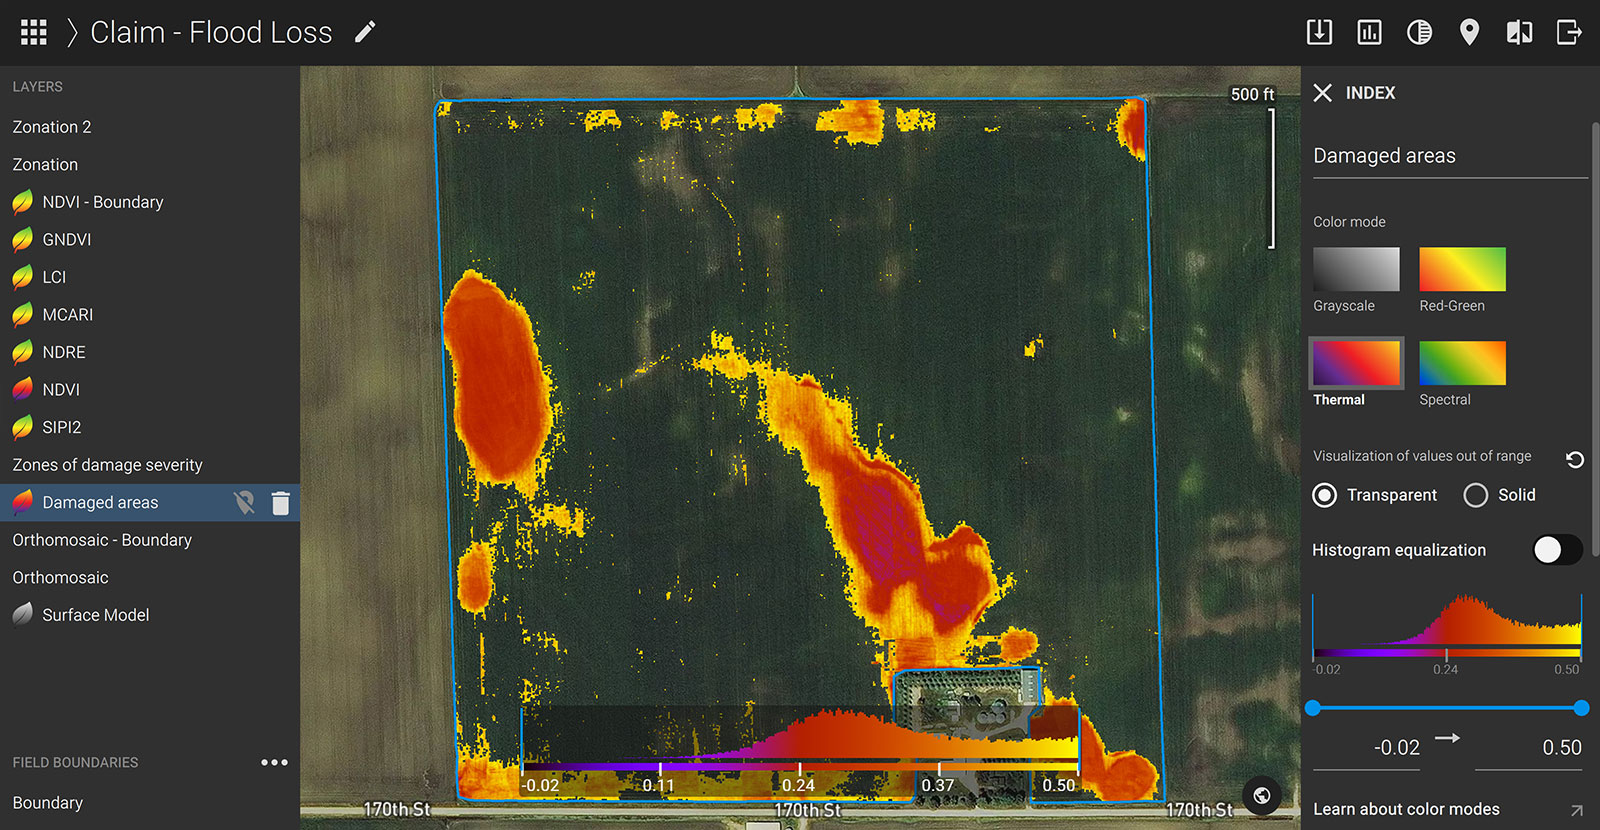
To do so the loss adjuster can use the index calculator in Pix4Dfields and create a custom index. Because NDVI is good at detecting vegetation, it is also very good at finding bare soil which is typically lower than 0.3.
By using the custom index formula: (nir-red)/(nir+red) + 0/min(0; (nir-red)/(nir+red) - 0.25), the software can mask all the vegetation pixels except the ones showing the bare soil which in this case represent damaged areas.
Another option is to visualize only the values you want to focus your analysis on with the Pix4Dfields advanced layer visualization tool.
Quantifying the damage severity
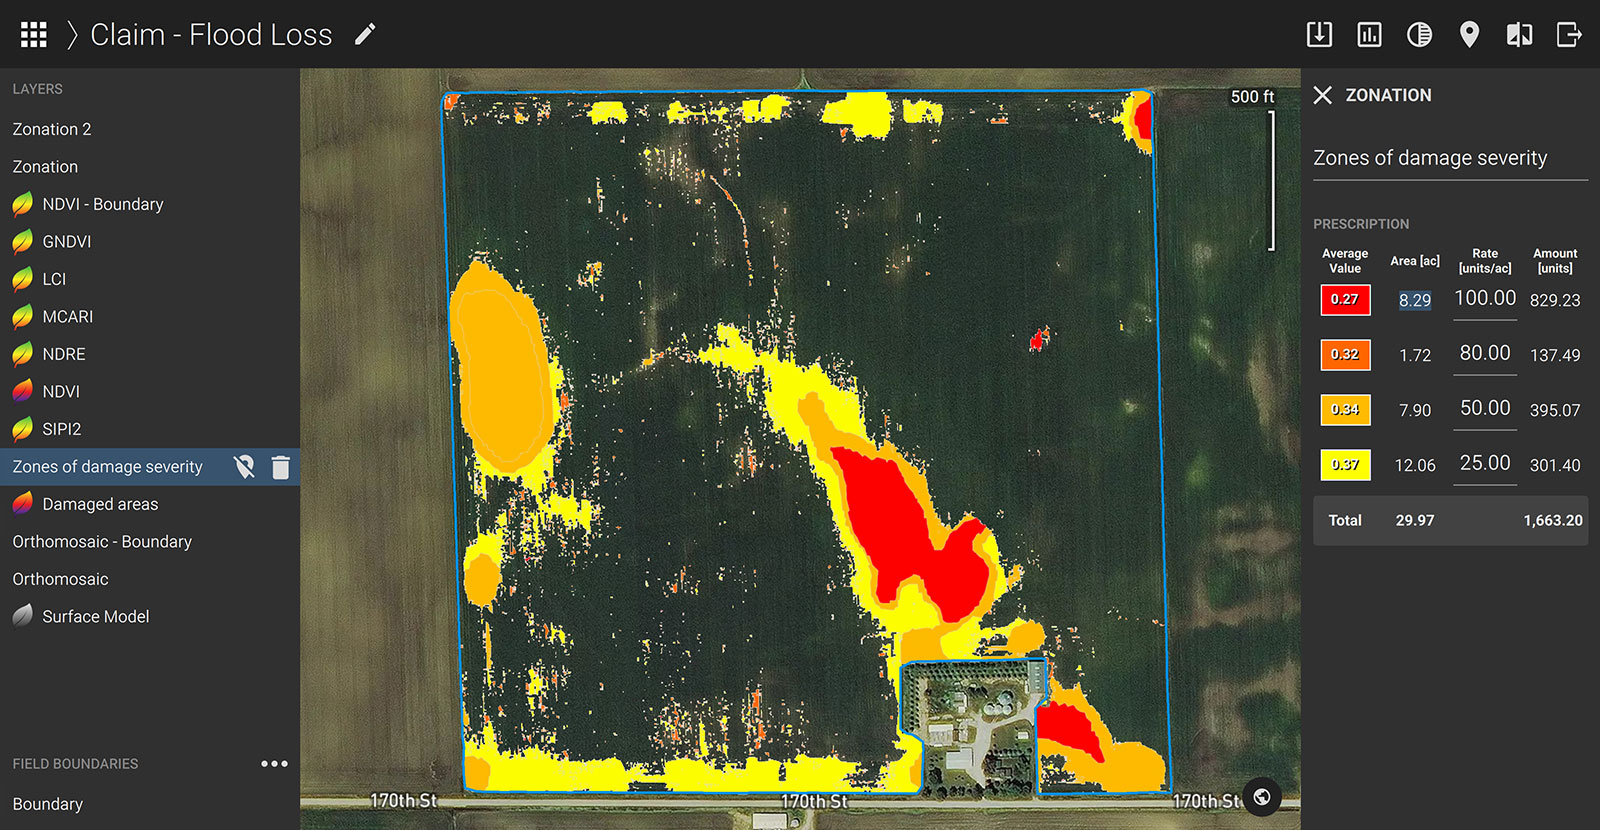
Later on, by using the zonation tool in Pix4Dfields the loss adjuster can quantify the results into acres and severity of damage.
Each zone will have an associated level of loss category (for example, 100% damage for the red zone on 8.3 acres and 50% damage for the lighter orange zone on the 8 acres).
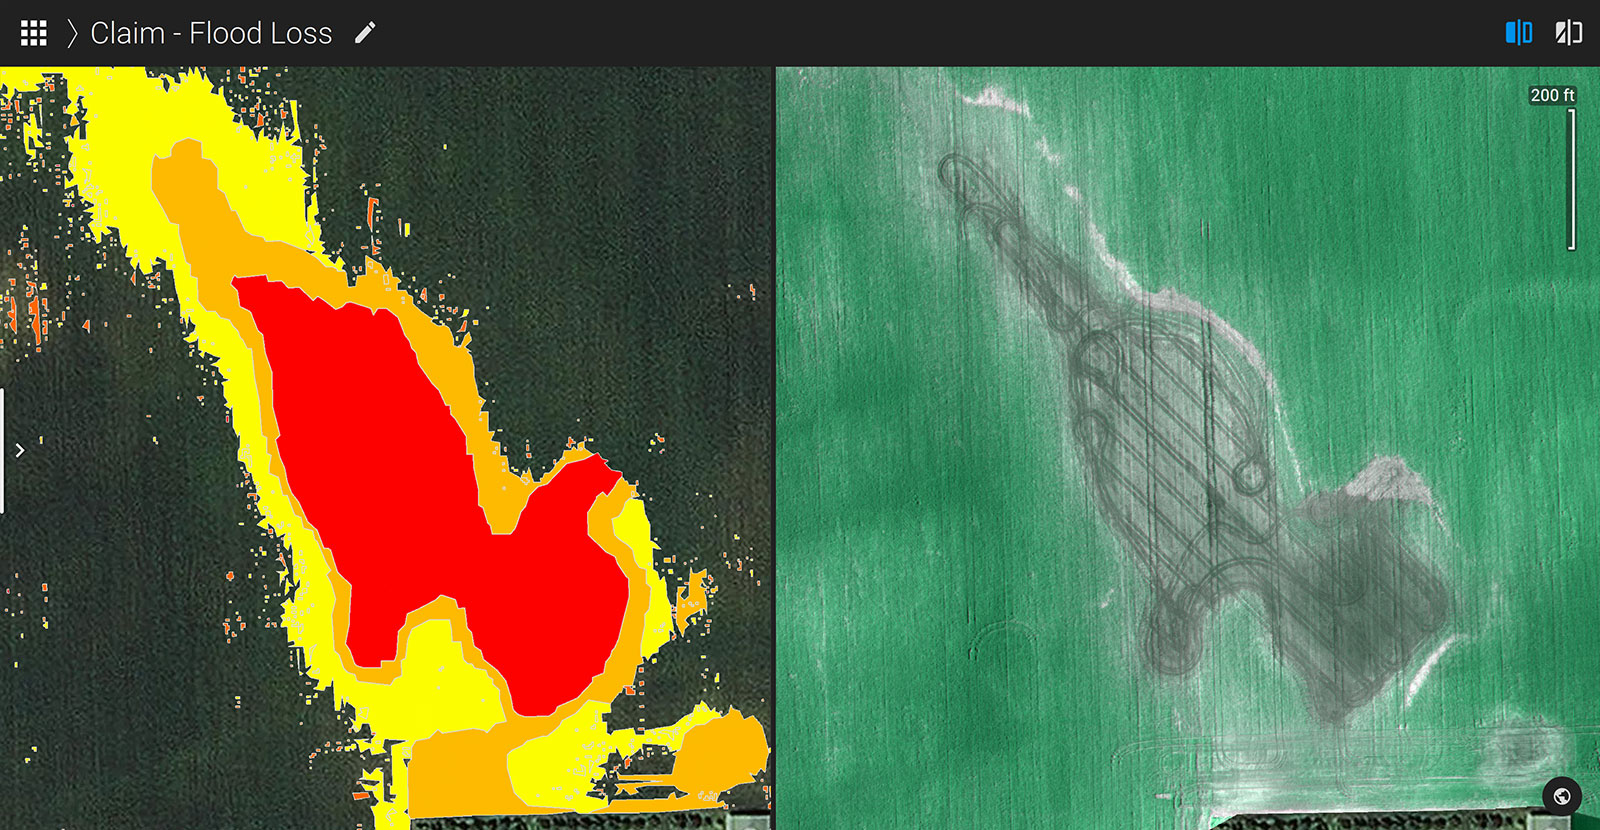
The comparison tool can help to give more context and validate the loss adjuster’s findings. This tool is useful because it can also enable the loss adjuster to compare the same field before and after the damage.
Inspecting the flood-damaged field and reporting
Zonation outputs can also show the rings of varied damage intensity. This can be used as an indicator for the loss adjuster of where to go in the field to inspect the damage level. Once in the field, the loss adjuster can take ground images and annotate them for the purpose of extra information and context.

The final step is creating a PDF report that summarizes this survey. The loss adjuster can send it to the farmer’s email so they have a paper record of the damage. This also works as proof because the PDF report includes the time and date of creation.
Each information layer tells a piece of story
With crops it’s important to have the right information at the right time in order to react correctly. Drones help to accomplish that. Insurance companies and agents want to make sure that when a farmer is in need, they get the help they deserve.
By using the combination of a drone and analysis software the process becomes faster, more efficient and accurate.
It’s because of examples like this - using drones for insurance, farmers can get verifiable proof that they can use for their compensation. And on the other hand, insurance companies positively stand out in the industry as the main stakeholders in helping farmers recover and stay in business after a disaster.
References
| ¹ "Claims Process", United States Department of Agriculture Risk Management Agency. Back to top ² "Loss adjustment manual (LAM) standards handbook, 821H" Federal Crop Insurance Corporation. Product Development Division.(2019). Back to top |