Detect the heat tolerance of sweet potatoes in Peru
What kind of data can you get from aerial-imagery in the field? Can thermal responses of sweet potato canopies be related to the plant yield at harvest? This project asked these questions as it monitored 2,100 plots in Northern Peru.
| Organization | IRD (Institut de recherche pour le développement) |
| Country | Peru |
| Industry | Agriculture |
| Software | PixDmapper photogrammetry software |
| Project Date | From 2014 |
| Project Members | Olivier Dangles (IRD), Bettina Heider (CIP) |
| Project Size | 3 Hectares |
| Number of Images | 440 (RGB) ; 180 (Infrared) |
| GSD | GSD 1.5 cm (RGB) ; 5 cm (Infrared) |
Is the thermal response of sweet potato canopies related to the plant yield at harvest?
The project scope was to determine if high resolution UAV thermal infrared imagery permits the detection of heat tolerant varieties of sweet potato directly in field. Is the thermal response of sweet potato canopies related to the plant yield at harvest?
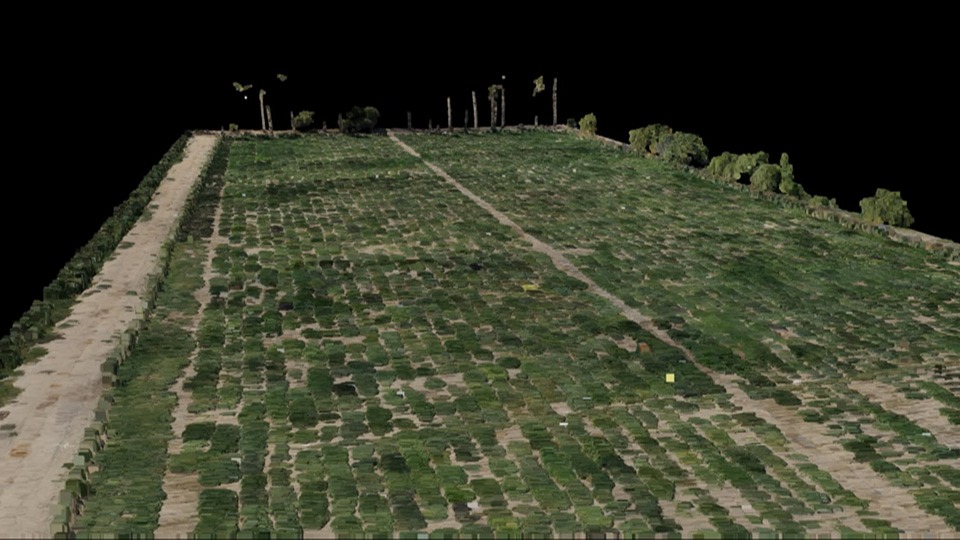
We flew two times over an experimental field and generated a mosaic of 2,100 plots of a unique accession of sweet potato planted in the hot and arid coastal region site in Piura, Northern Peru.
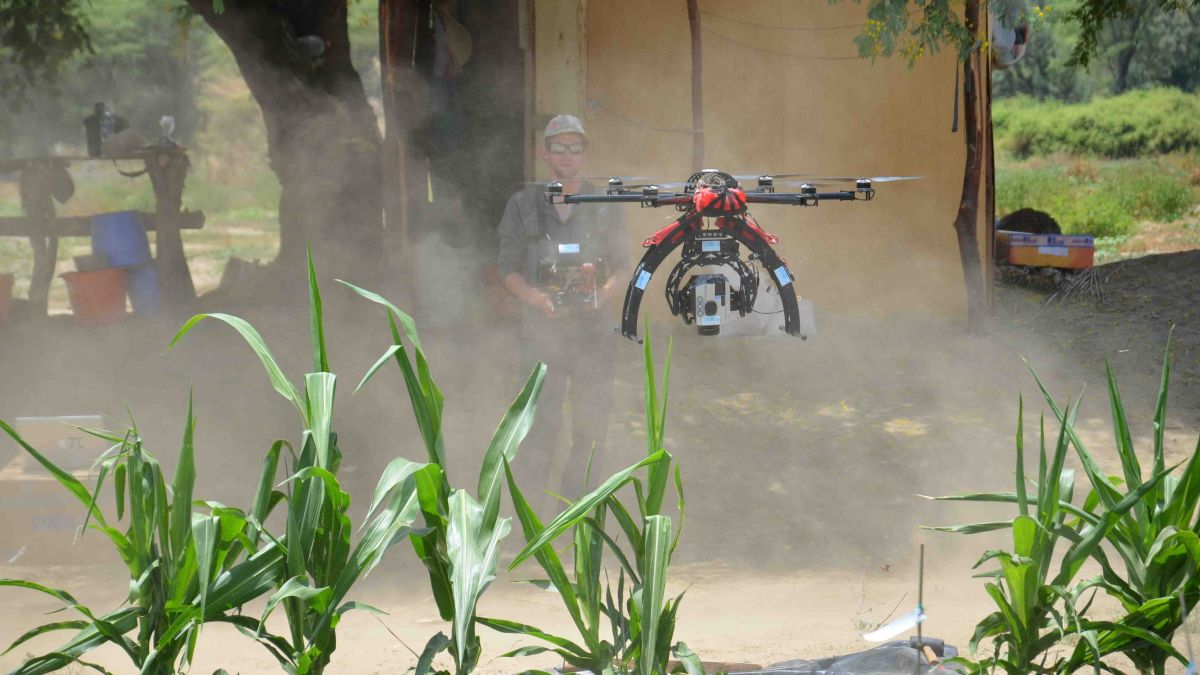
Flying the field
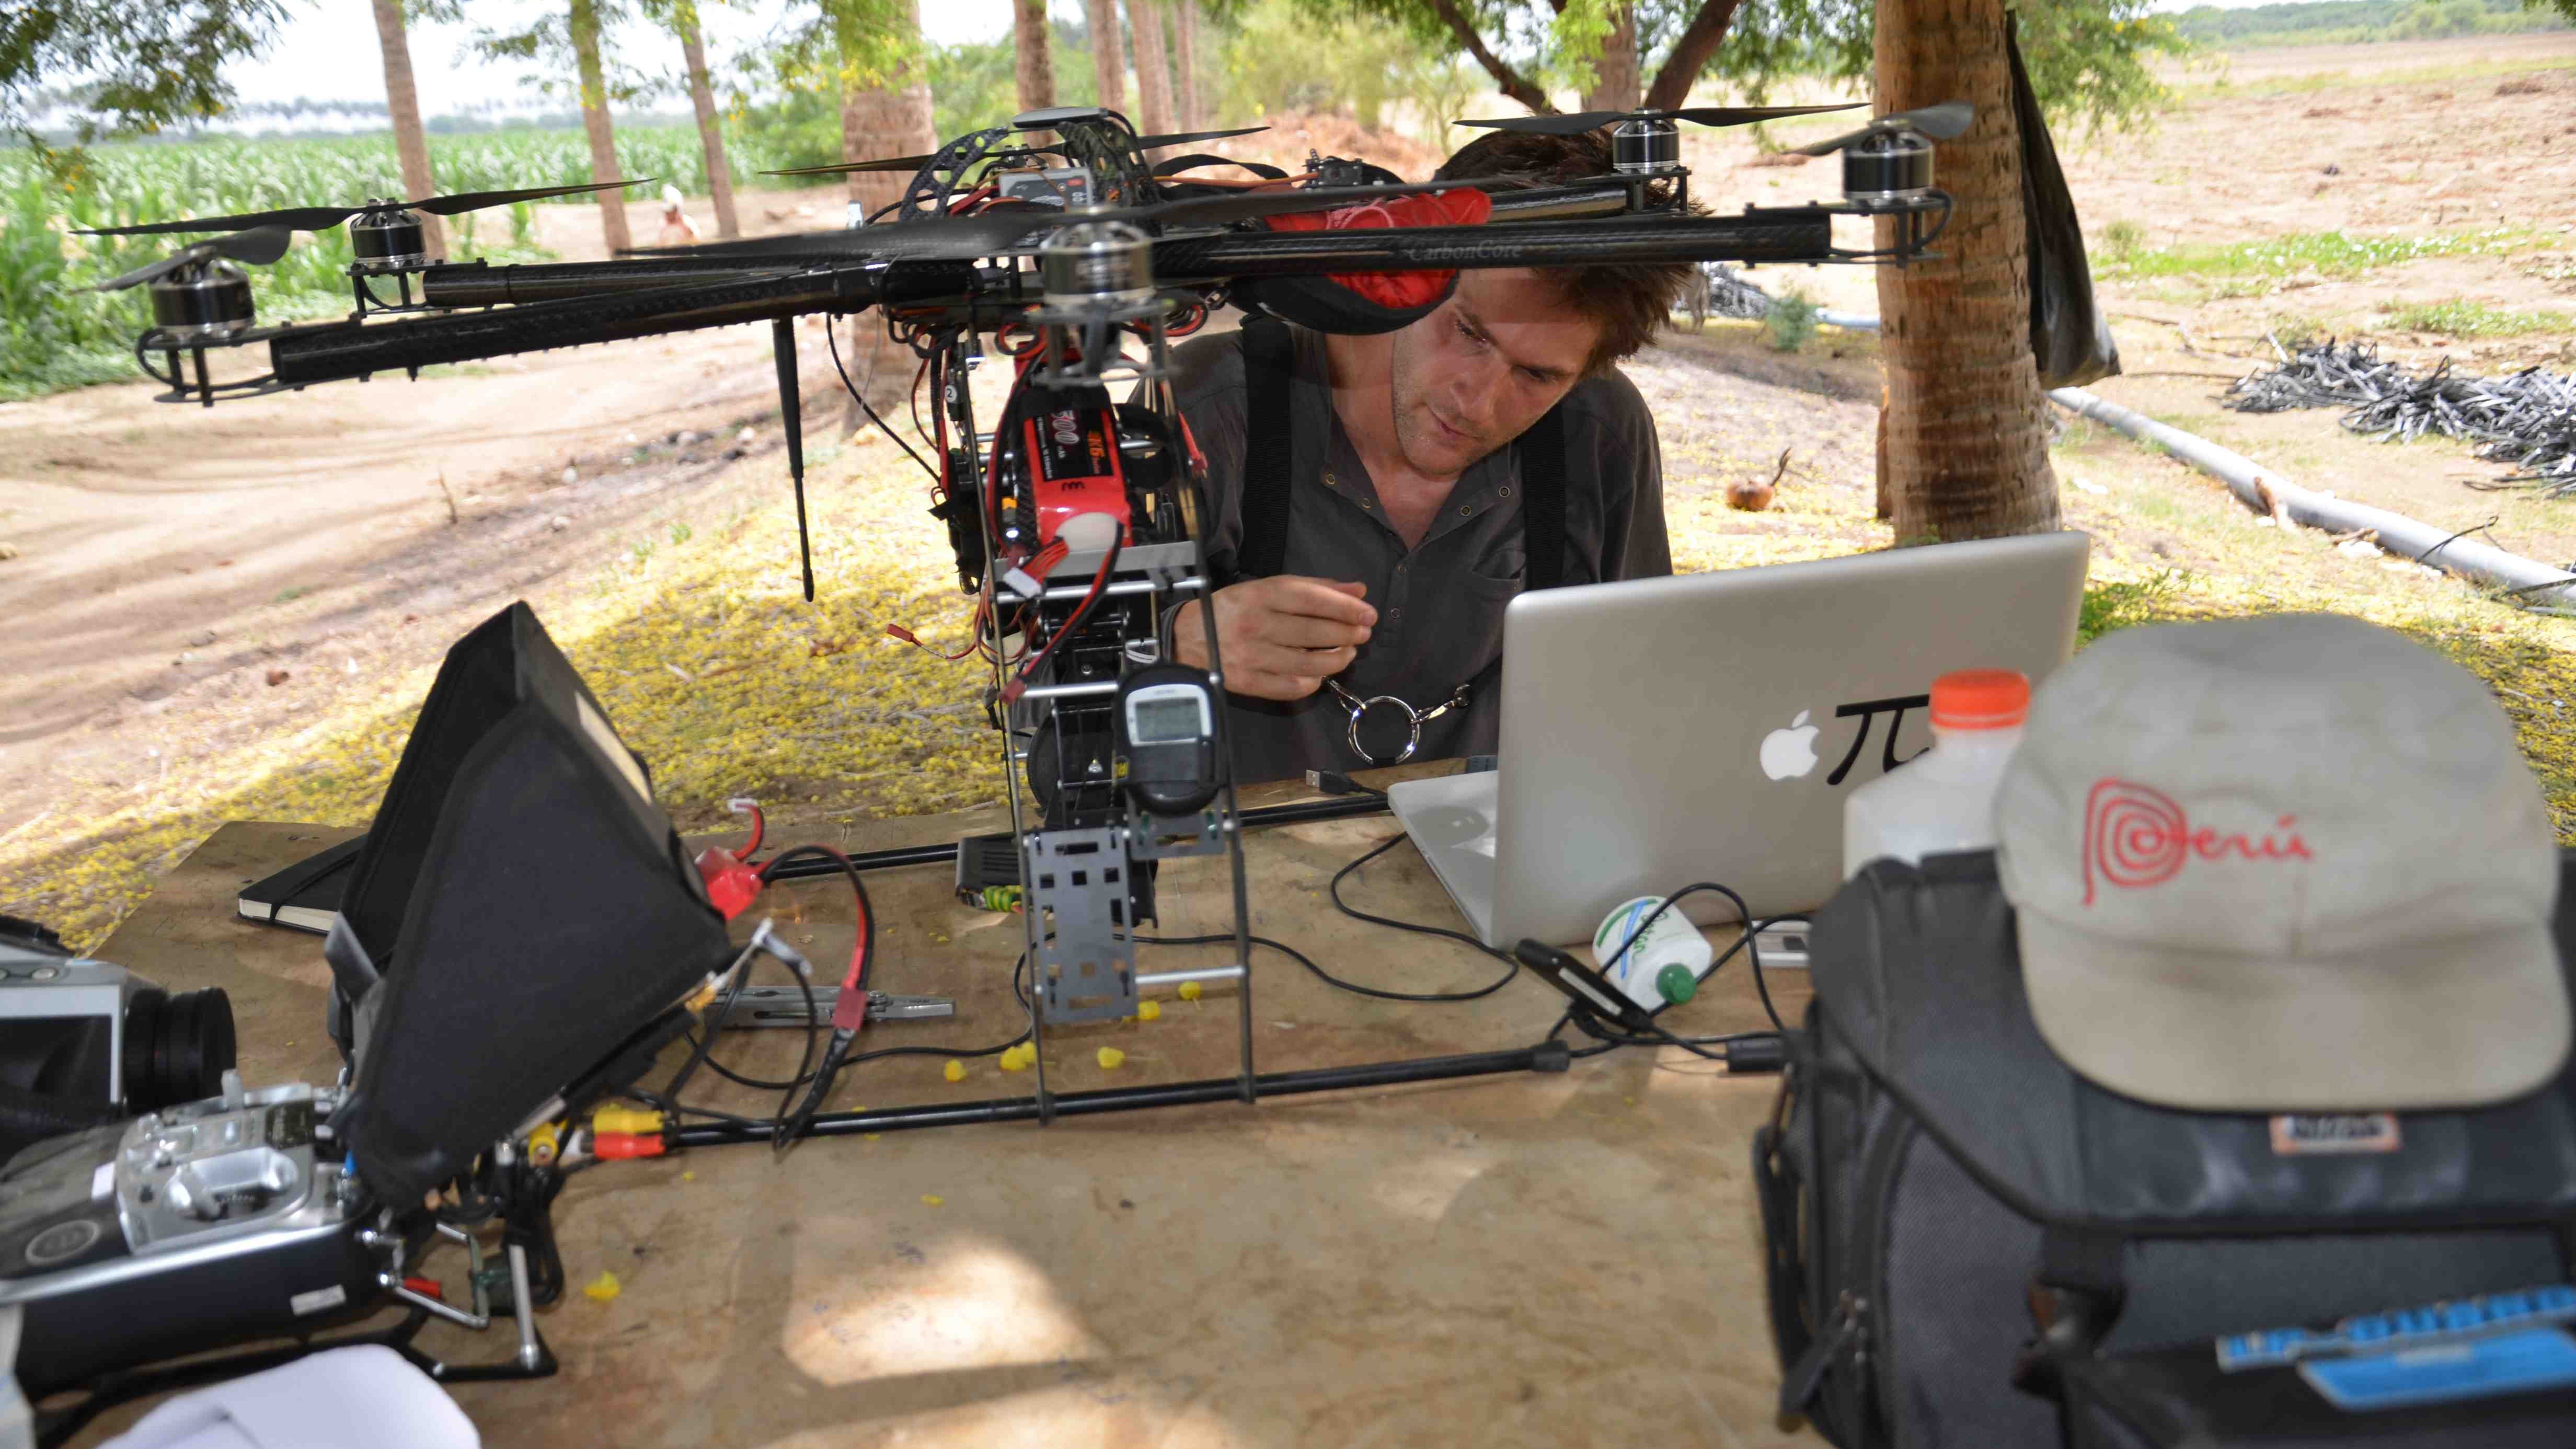
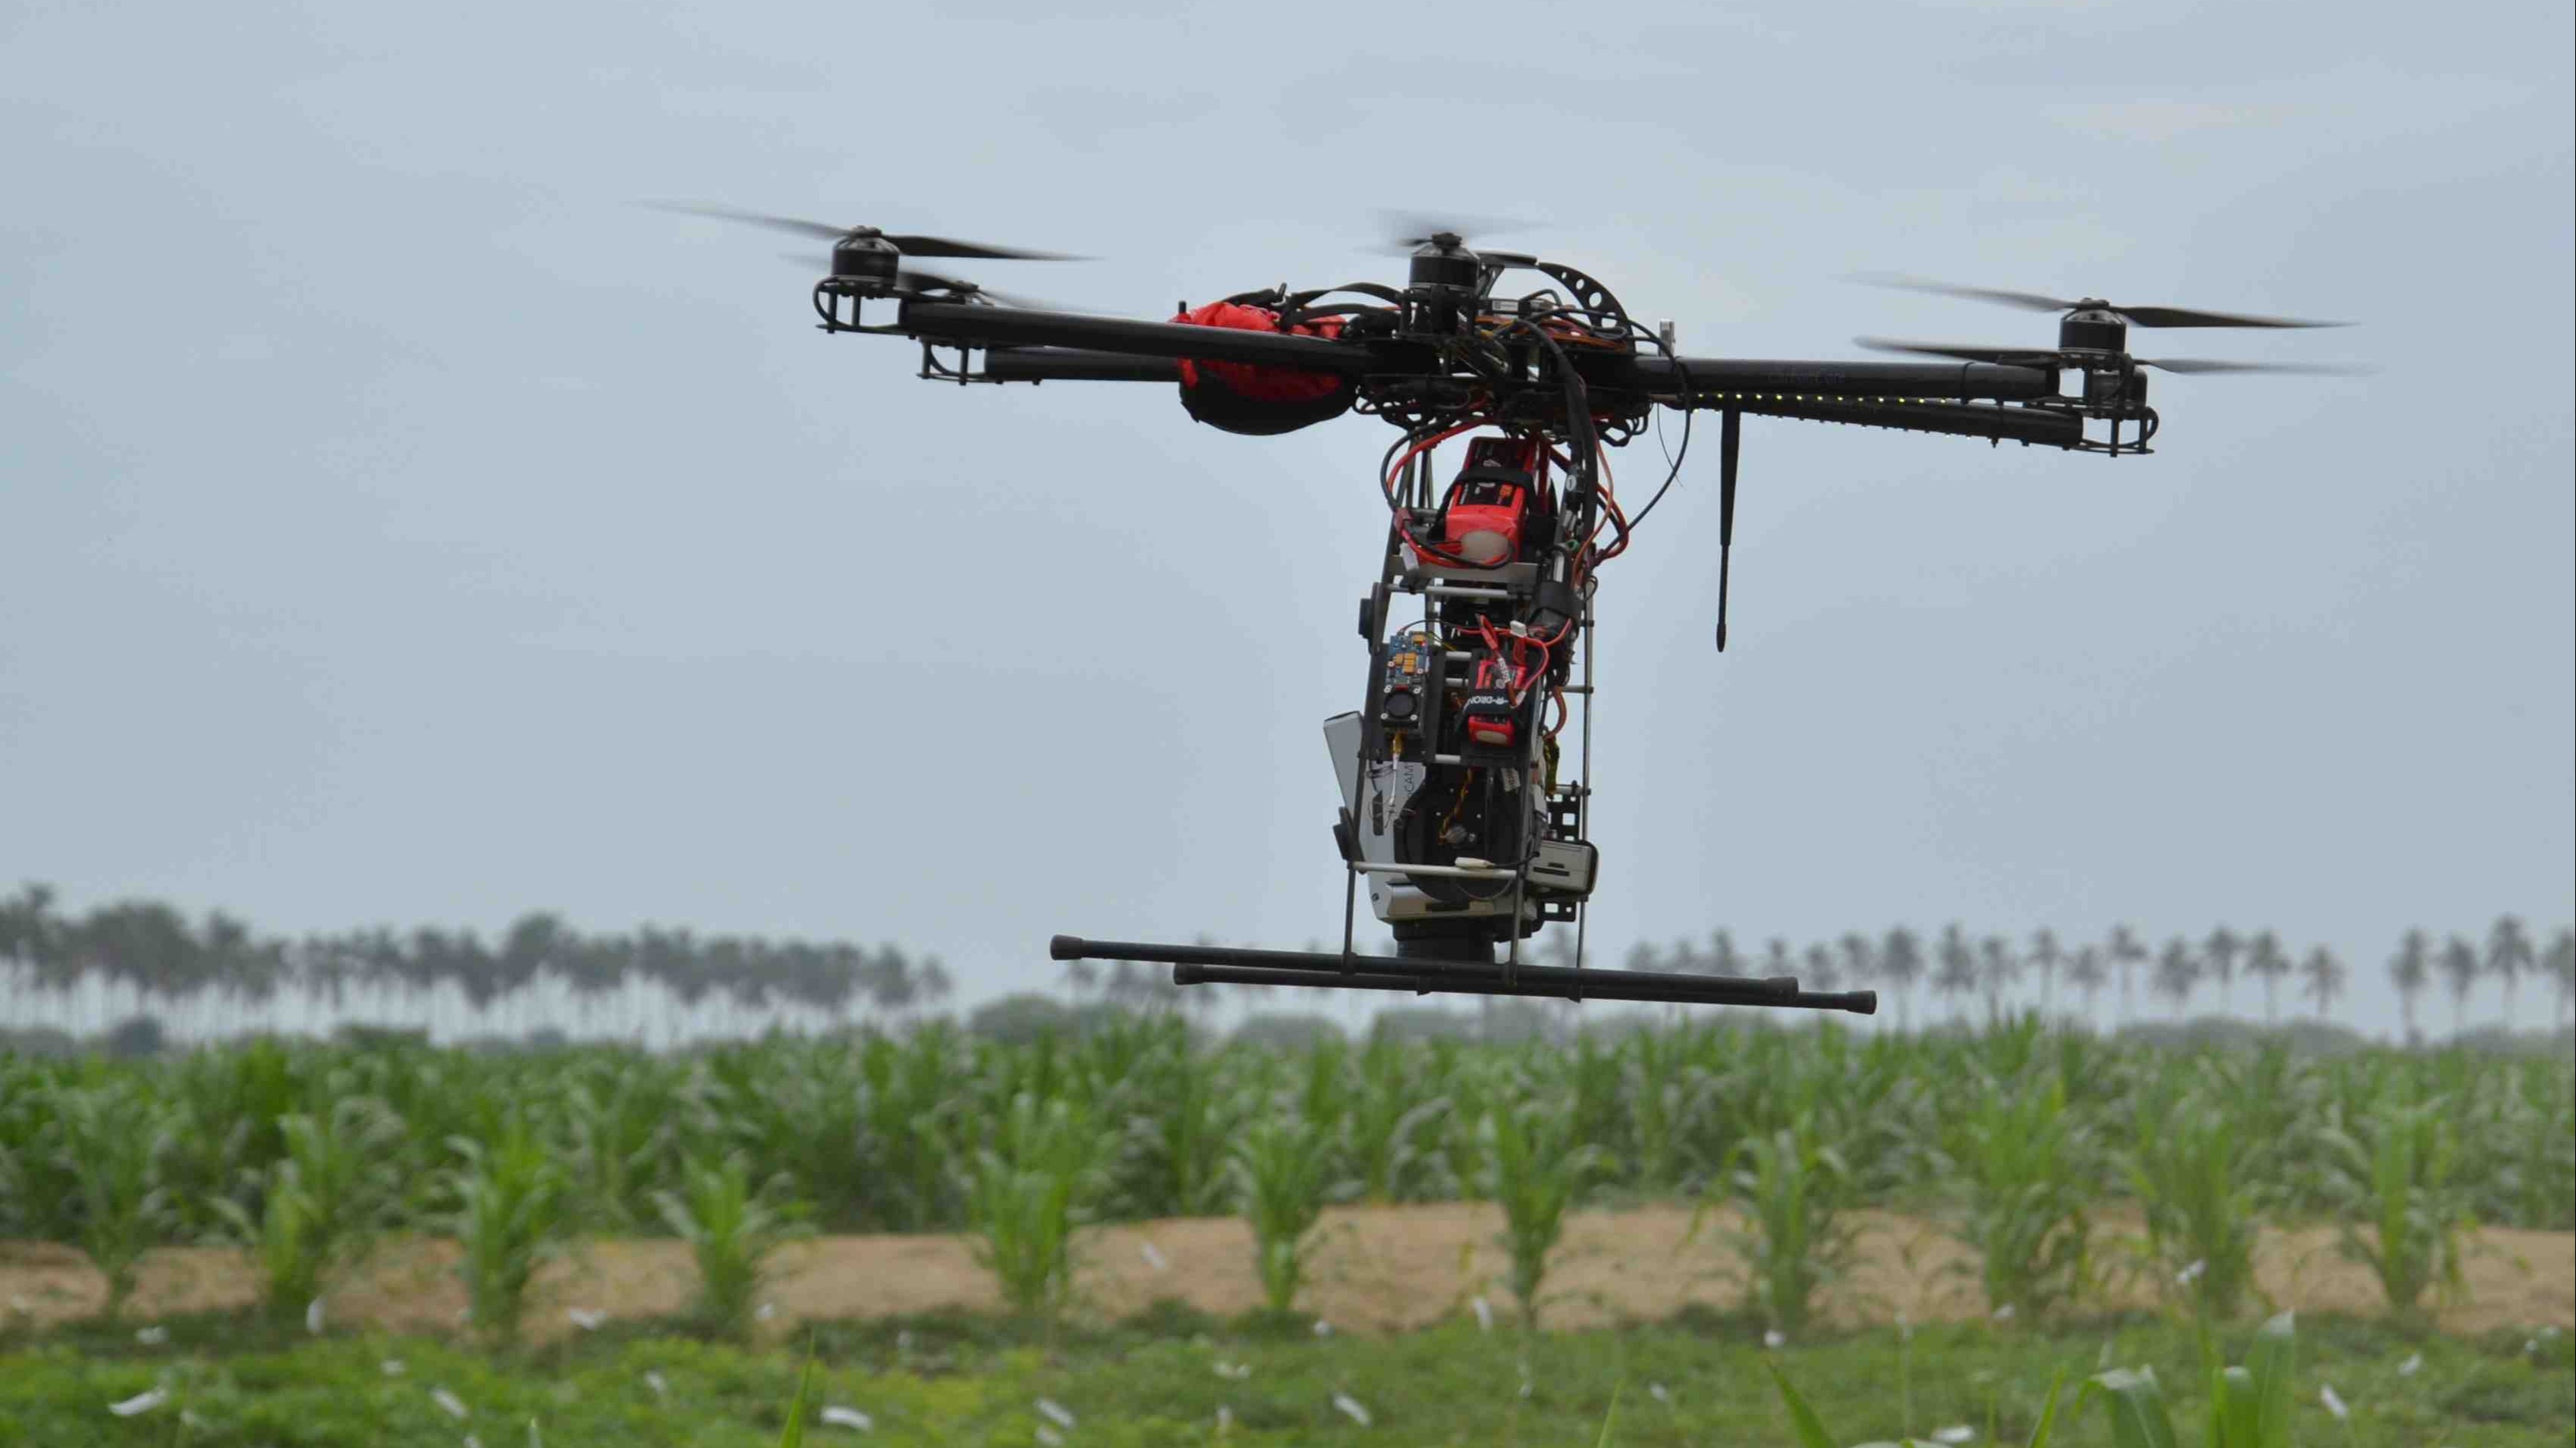
A customized hexapter, with 2kg of capacity, was used with the assistance of DJI Wookong M autopilot for optimal control and flight planning. Three flights at 60 meters of altitude and 2 m/s of speed were planned for both visual(RGB) and thermal infrared image sets.
Visual RGB images were acquired by a SONY Nex-7 camera, triggered every second. The three missions were completed in around 10 minutes. For the thermal infrared images, an Infratec HR reserach infrared camera was used during the seven-minute flight duration.
Extracting the thermal information of plant canopies
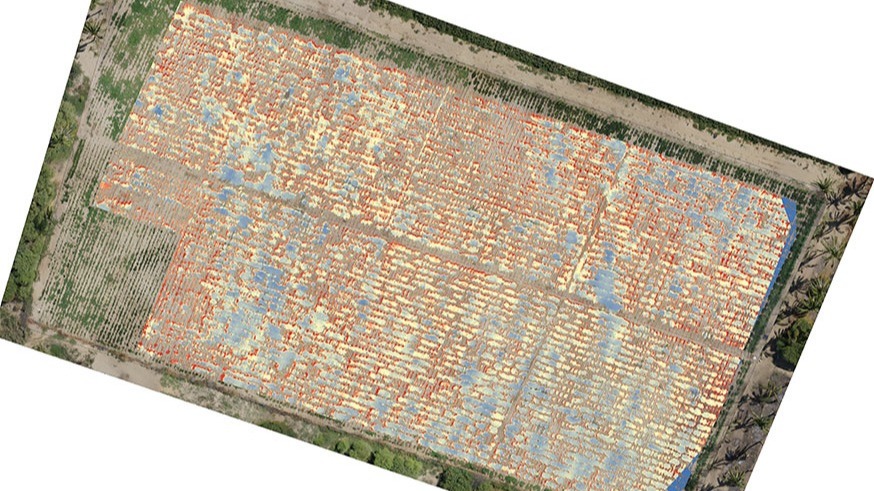
The project is still ongoing, but we generated the results with the Pix4Dmapper photogrammetry software, using a high resolution visual (1.3 cm/pixel) and infrared (5 cm/pixel) orthomosaic to extract the thermal information of plant canopies only (at two different phonological stages) for each recorded plot of our experiment.
The georeference of the two data sets (visuals and infrared) allowed us to overlay them in the GIS platform, select the canopy areas on the visual orthomosaic using raster classification and clip the infrared orthomosaic based on those RGB canopy areas. Then we compared the infrared statistics to the yield of the plant studied (yield/plant, dry matter, harvest index, etc).
Why use drone-mapping in agriculture?
Mapping with a UAV and Pix4Dmapper is a significant improvement in our workflow as it allows us to capture high-resolution imagery, process mosaic images and point clouds quickly, and generate high-resolution visual and infrared orthomosaic within a few days.
Before, the same image capture process from the ground took more than a month, with 4 people working full time on the same project!
Therefore, UAVs and Pix4Dmapper are an efficient toolbox for fine spatial and temporal scale remote sensing data acquisition. Results are easily repeatable, timely and cost-effective, offering a promising route for research applications.