2D and 3D annotations synchronized on Pix4Dmapper Cloud
We’re constantly updating Pix4Dmapper Cloud with improvements designed to make your work easier. You’ll see these updates have already taken effect next time you log into Pix4Dmapper Cloud.
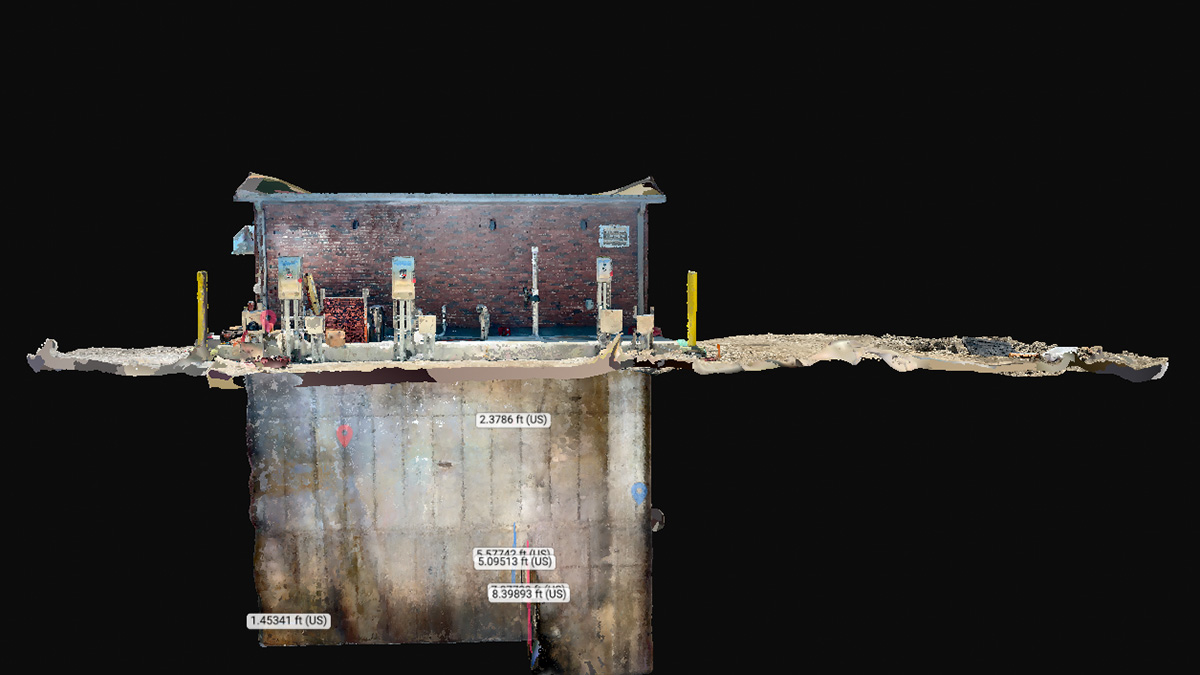
Synchronized 2D and 3D annotations
Now annotations and measurements, including elevation profiles and volumes, are fully synchronized across 2D and 3D views.
Whether your annotation is created in the 2D or 3D view, it will be preserved in and synchronized with the other view. Chalk out an elevation profile in 3D, then switch to 2D for a quick drone’s-eye-view of the site. Or measure a volume in 2D by tracing the outline of a stockpile, and then switch to 3D to check you’ve captured the right points.
Plus, elevation information is now taken into account when adding 2D measurements. When you add a distance annotation to your orthomosaic, additional elevation and slope values are now available in the right panel.

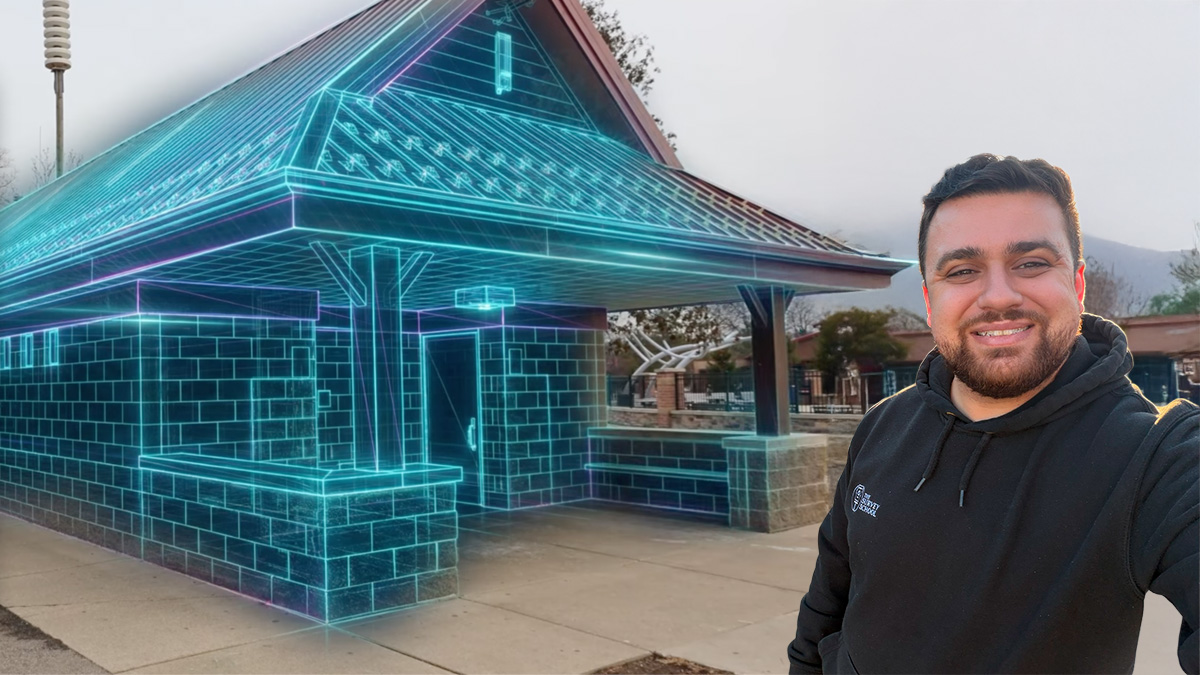
Refreshed interface layout
Work more efficiently with an updated user interface. The refreshed left menu of Pix4Dmapper Cloud now represents the point cloud and 3D textured mesh as layers. These can be visualized together or separately with the click of a button. You can also reveal more details by setting the layer’s opacity.
Plus, toggle easily between 2D and 3D views with the button at the bottom of the screen.
More point cloud settings
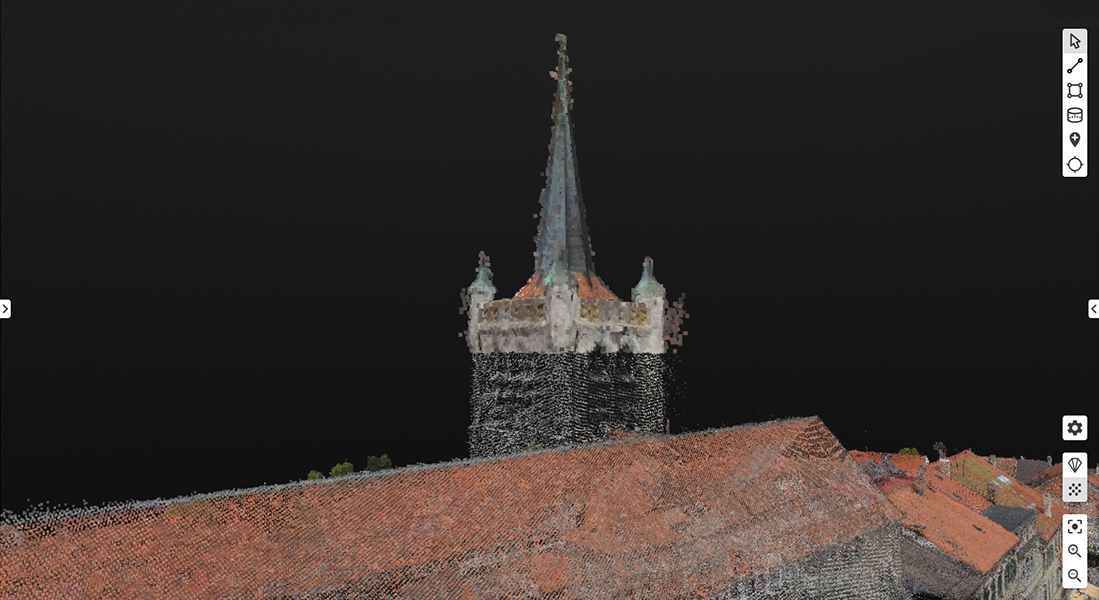
We’ve added more point cloud settings to give you more control over your project. This latest update introduces fixed point size, complementing the default adaptive resizing option.
Adaptive (or dynamic) resizing means that the size of the points is adapted to the LoD (level of detail) displayed on screen. Generally speaking, a lower LoD means bigger points and a less detailed project displayed on your screen.
In addition, fixed point sizes make some features look better - especially models which contain thin structures. For example, this church steeple doesn't have enough points so the algorithm is assuming it has a lower LoD and making the points larger - resulting in a artifacts on the structure. That wouldn't happen with a fixed point size.
You can adjust the point cloud settings in the point cloud attributes on the right panel
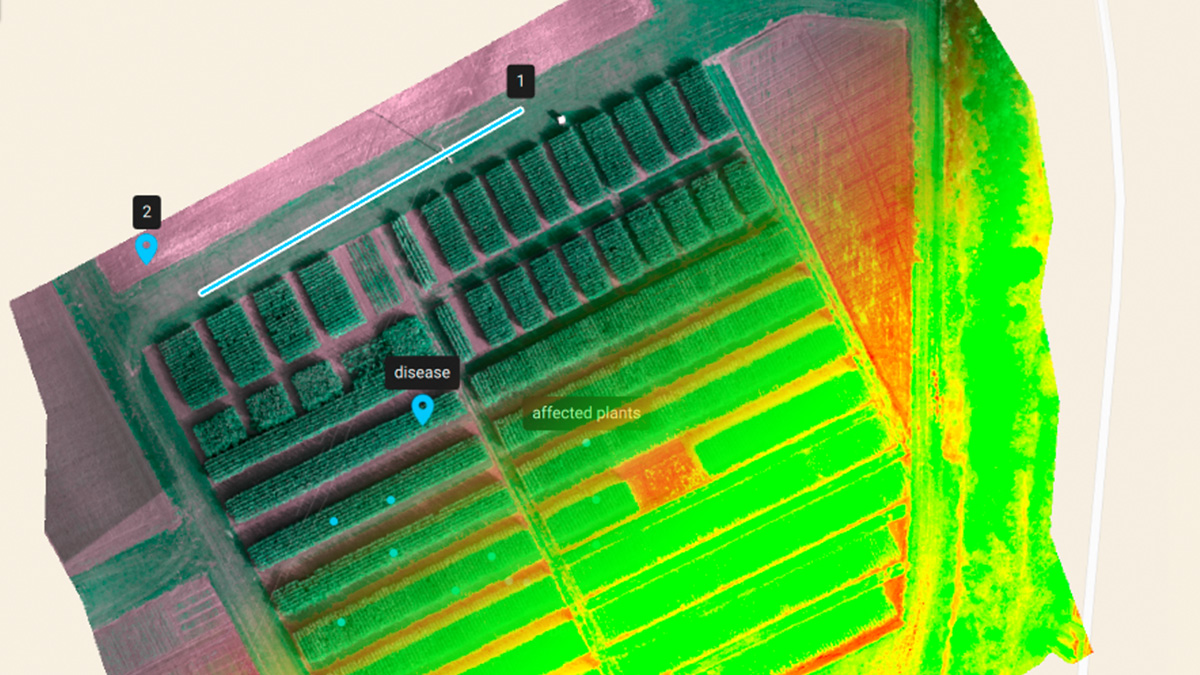
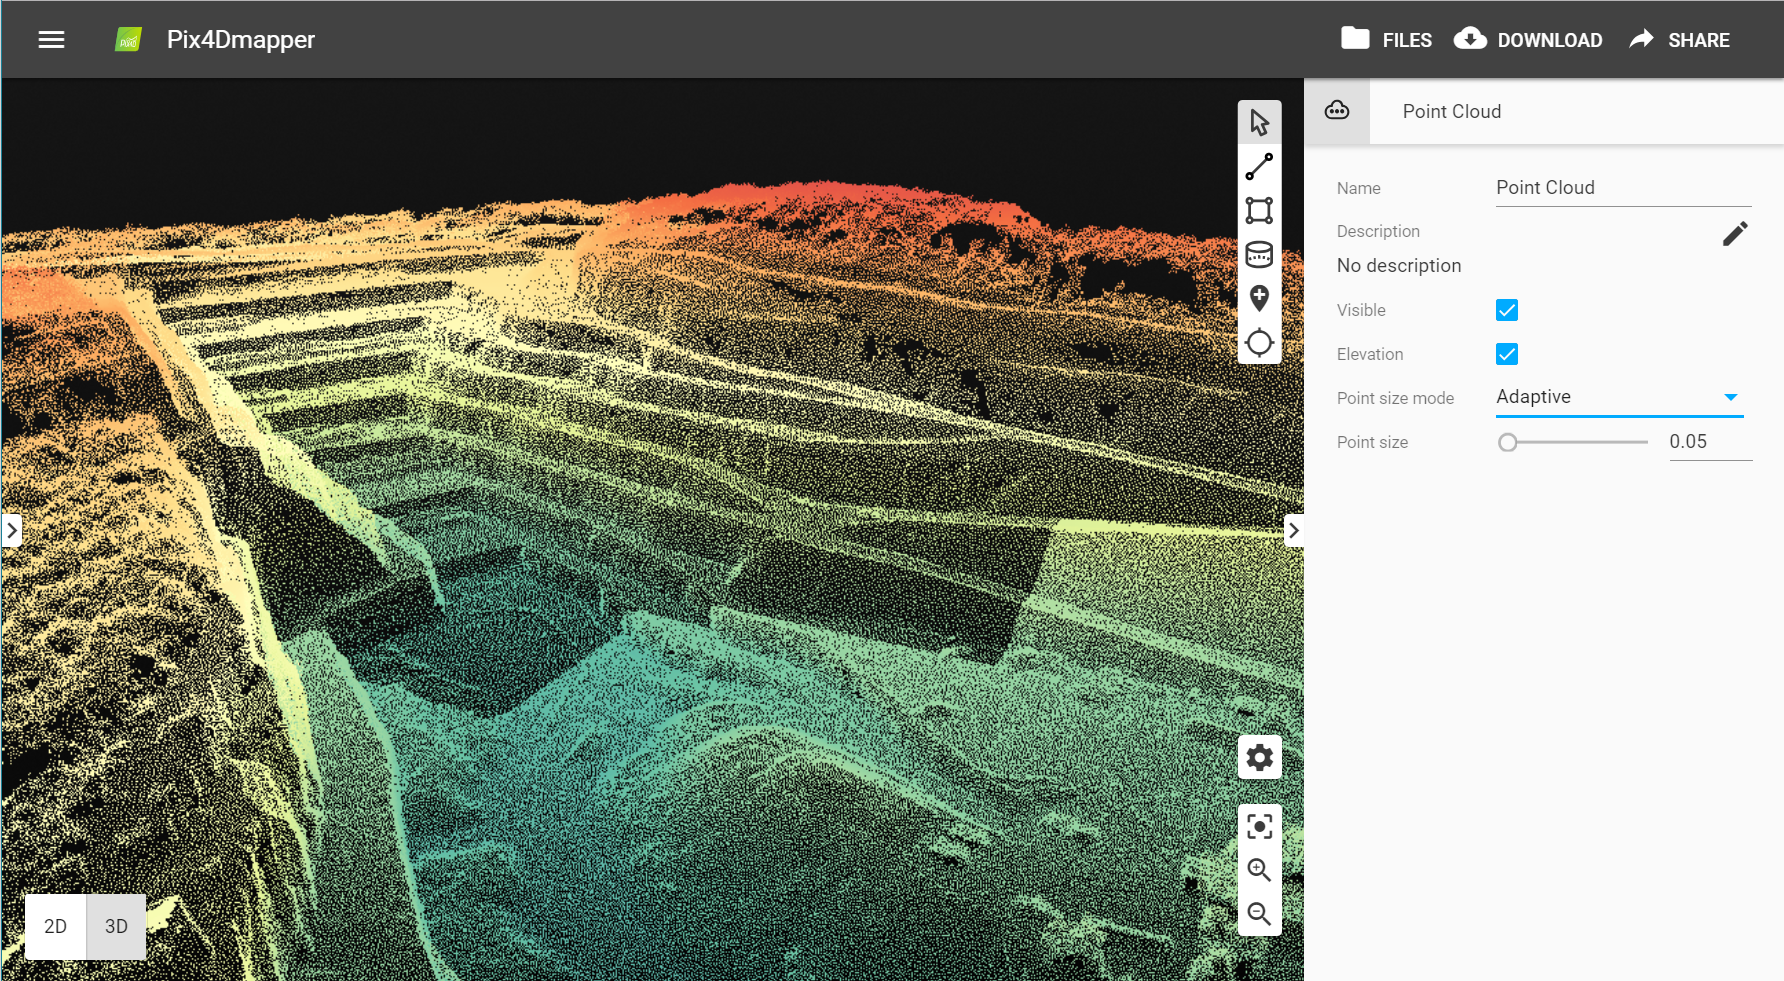
Elevation color scale for easier visualization
Review elevation at a glance with the elevation color scale for the point cloud.
This overlay colors the point cloud according to each point’s height value, highlighting differences in elevation.
You can add an elevation color scale in the point cloud attributes on the right panel.
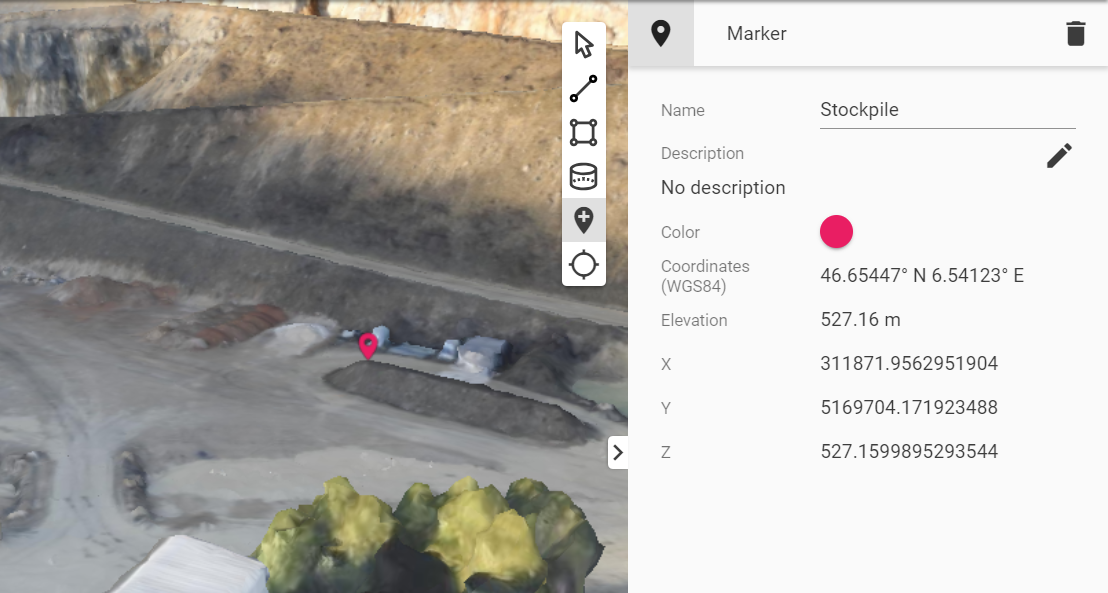
Coordinates displayed in project’s coordinate system
Now in addition to the latitude and longitude, metric coordinates are displayed for markers.
Both WGS84 latitude and longitude and X, Y and Z coordinates are automatically extracted and displayed in the right panel every time you add a marker.