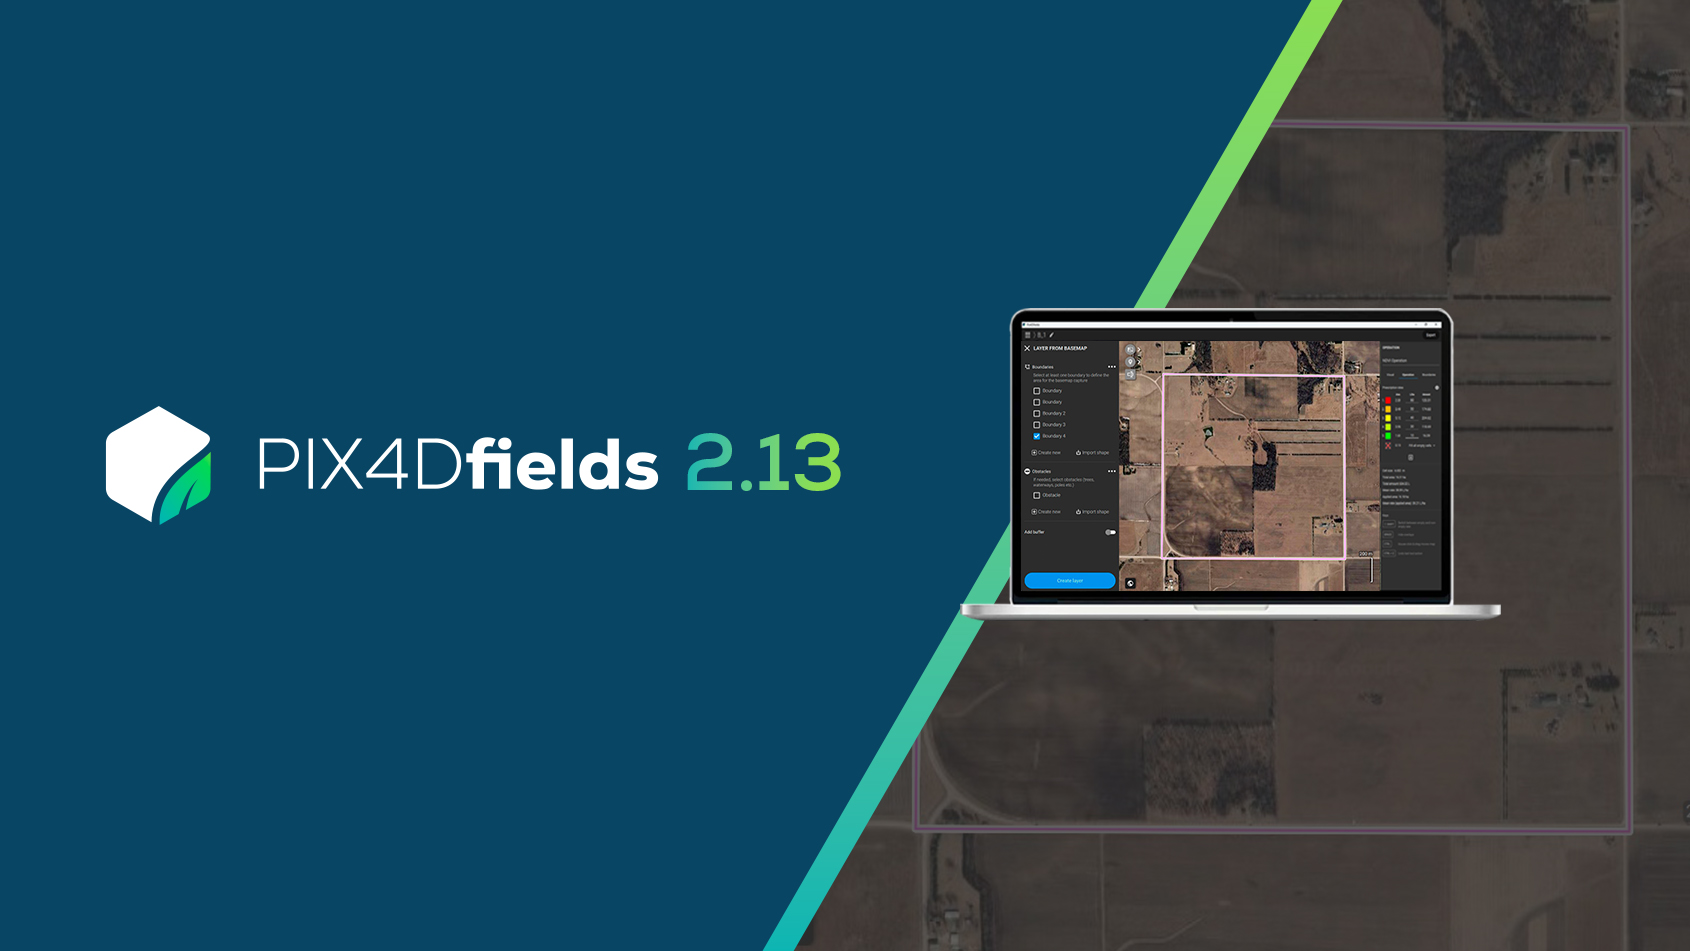
Pix4Dfields 1.9: trial plot management
The latest Pix4Dfields release brings a plethora of updated and new functionalities, meant to support you even more in your everyday agriculture workflow. To demonstrate the latest Pix4Dfields features we teamed up with the University of Missouri and their continuous experimental field “Sanborn Field”.
Improved user interface
The latest Pix4Dfields update brings multiple improvements and added functionalities to the user interface inside projects. This is especially focused on annotation management and boundary creation, with the addition of general changes to the feature button placements.
Comparing Pix4Dfields 1.9 (left) and Pix4Dfields 1.8 (right) side by side
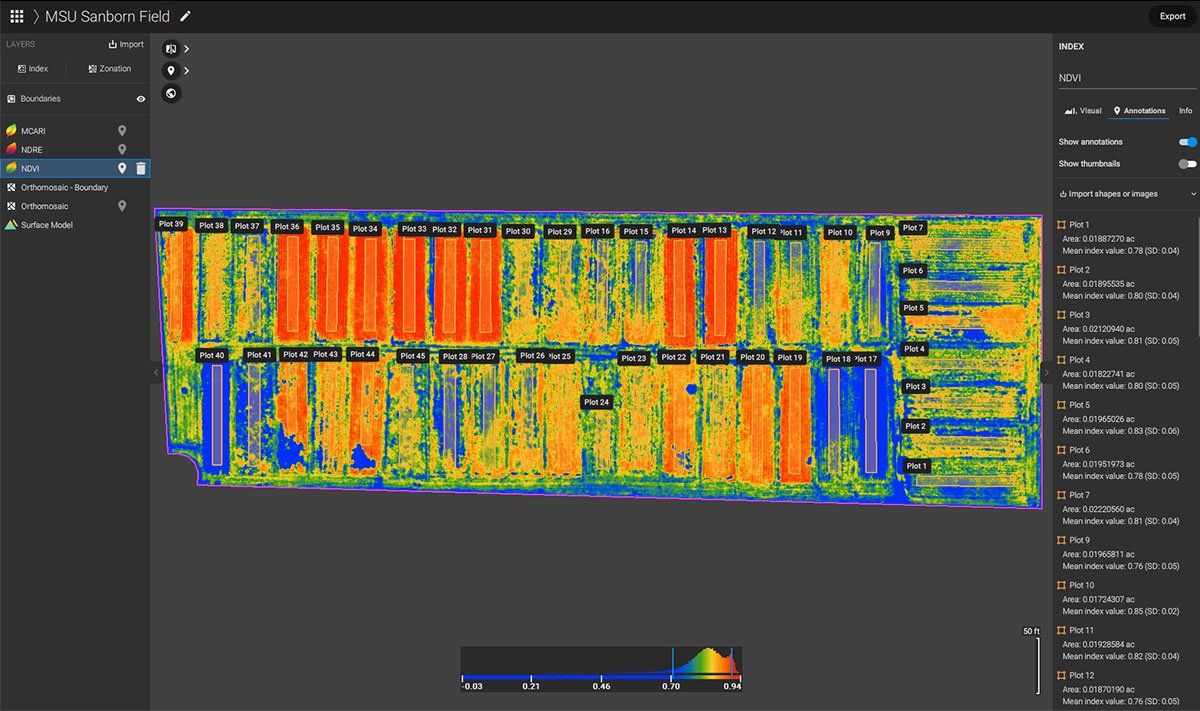
Statistics and CSV export
Pix4Dfields 1.9 introduces statistics (mean and standard deviation) for DSM and index layers as well as for area annotations. In addition, point annotations now display DSM and index layer values. Among the export options, layer and annotation statistics can be exported as comma-separated values (CSV files) and as a part of the PDF report.
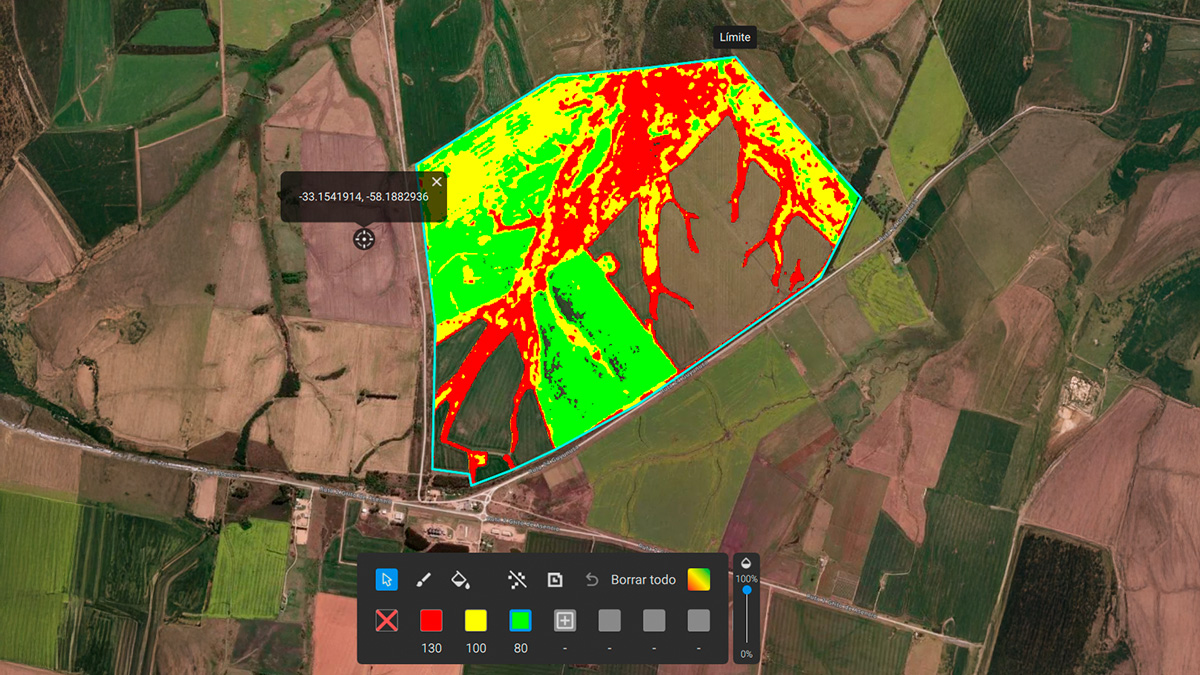
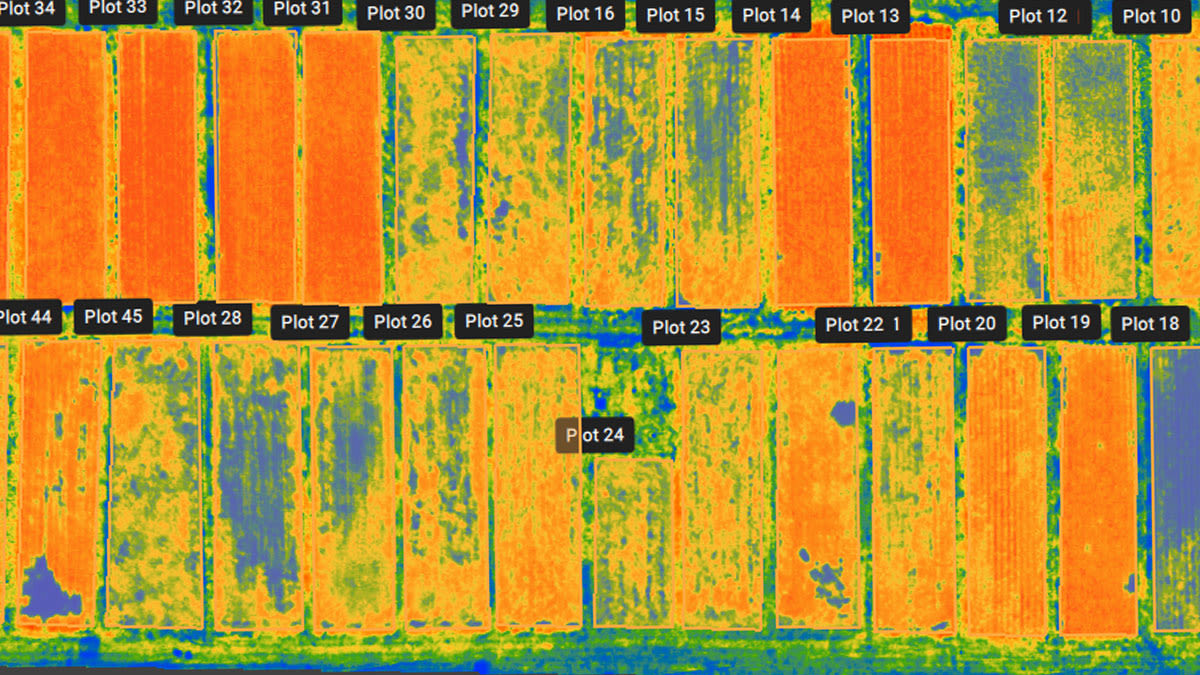
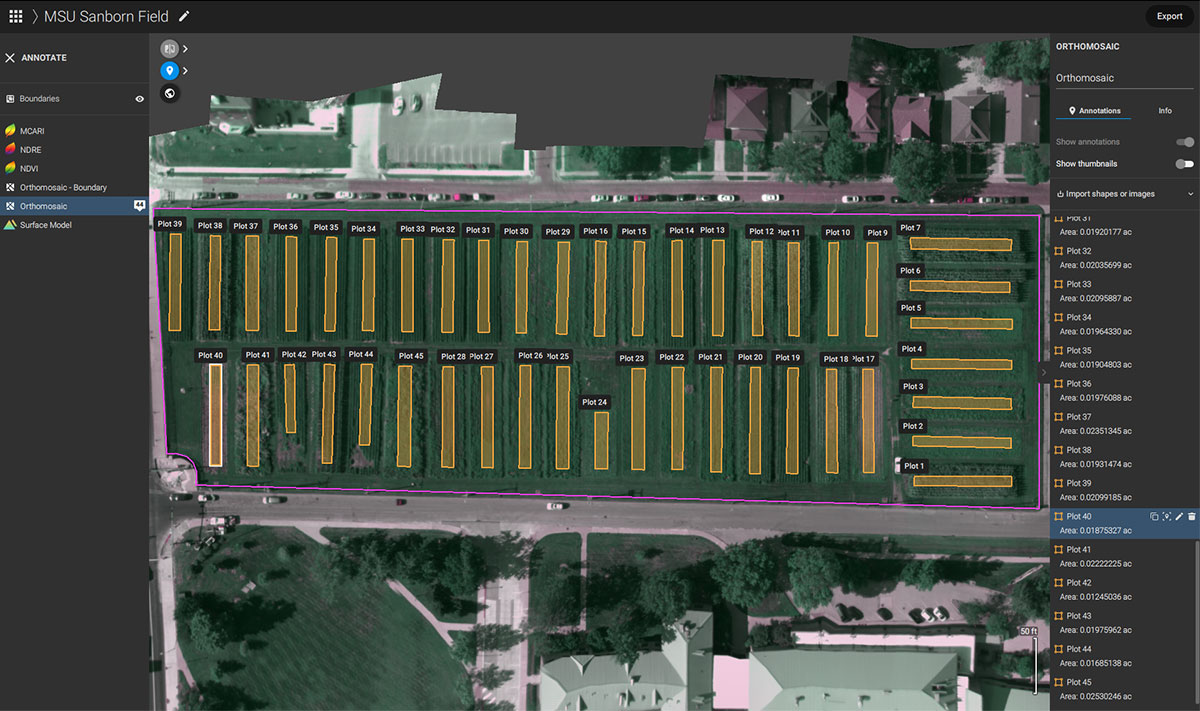
Added boundaries functionality
With the added ability to import a multi-polygon shapefile, users can now split multi-polygon shapes into individual shapes such as trial plots and use them for statistical calculations. Boundaries can also be duplicated, edited, and used for trimming the other layers.
See Pix4Dfields 1.9 in action
Watch our free webinar where we guide you through new and updated features and functionalities.
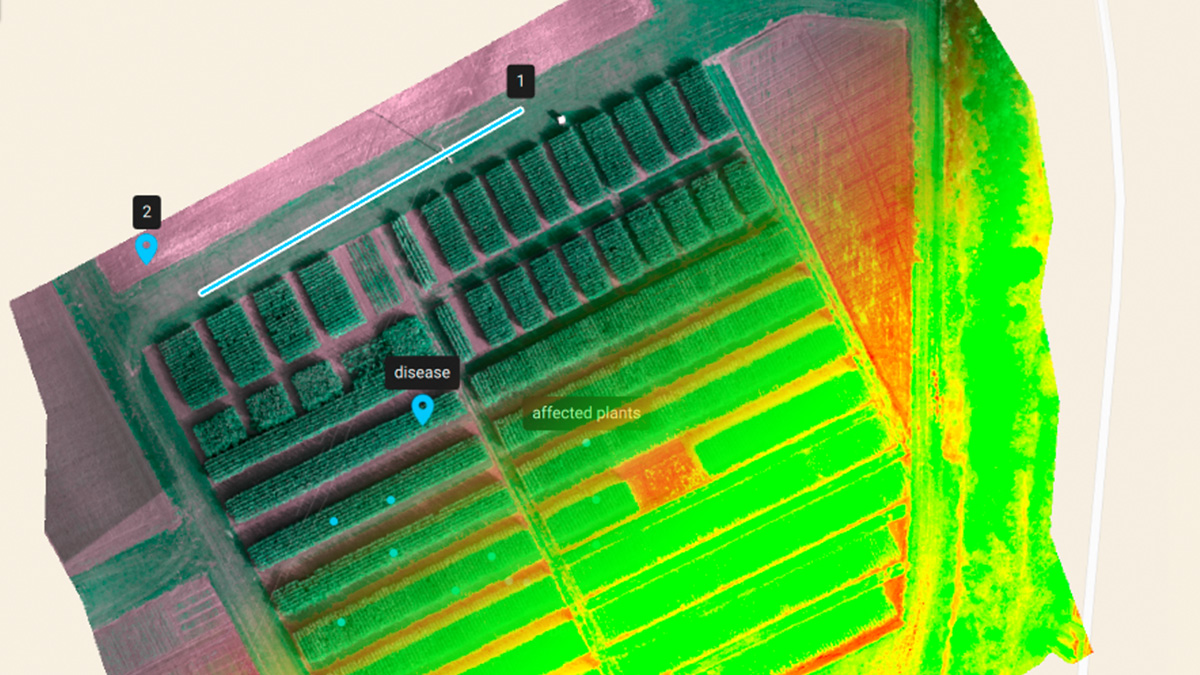
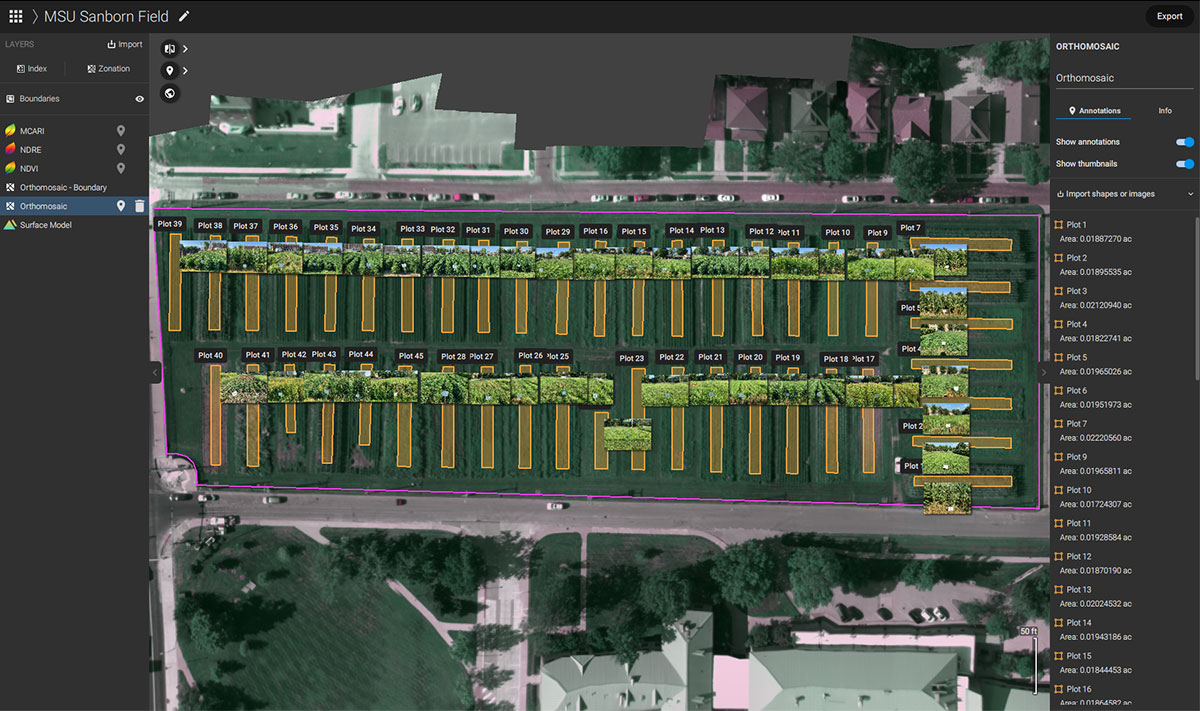
Create annotations from geotagged images
Users can now import GPS tagged images as geolocated annotations directly on the layer as well as display the images attached to the annotations directly on the map. Annotations (point, line, and polygon) can be duplicated, edited, or deleted. In addition to being exportable as GeoJSON and shapefile, annotations can now be exported as a KML file as well.
Support for RTK/PPK enabled drones
If your drone is equipped with a high-accuracy GPS, like the DJI P4 RTK or senseFly eBee X with RTK, Pix4Dfields can process the collected data to the same level of accuracy. This is great for accurate comparisons over time as well as showing the difference in indices and pixel values that represent changes in crops over time.
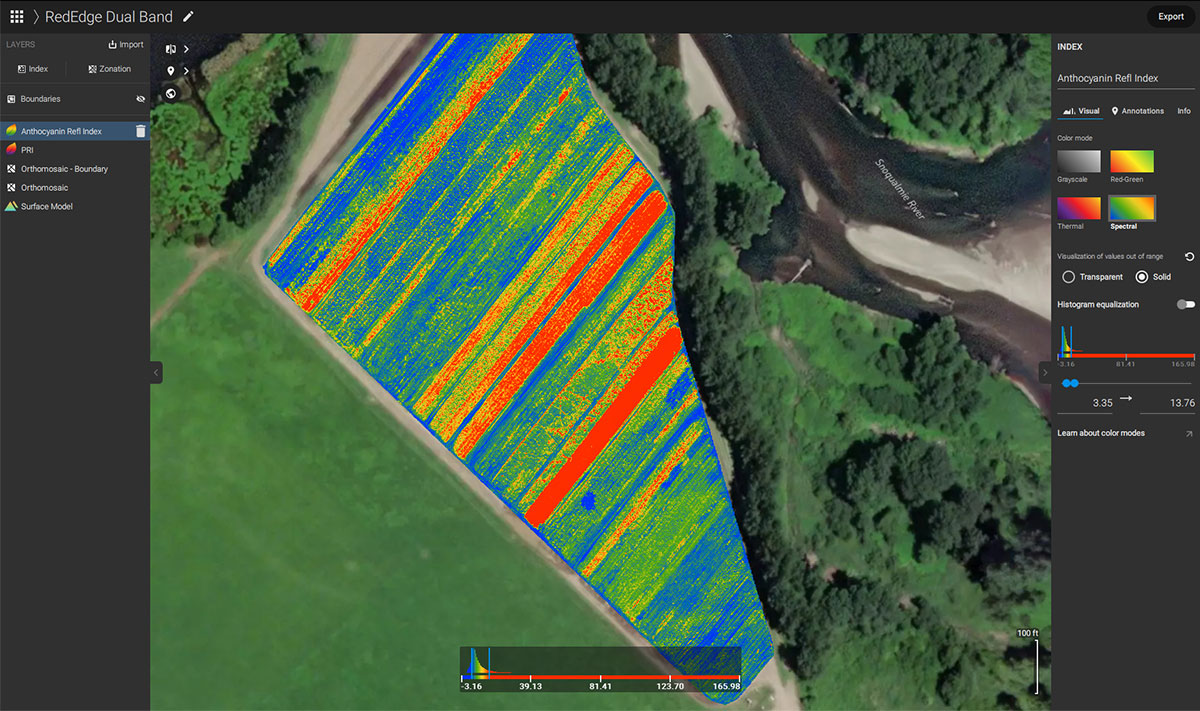
MicaSense RedEdge-MX Dual and Altum camera update
Pix4Dfields 1.9 introduces flexible band handling for MicaSense RedEdge-MX Dual (RedEdge-MX and RedEdge-MX blue sensors) including support for custom index creation in the index calculator using distinct band names.
| More information about the latest version of Pix4Dfields can be found in the release notes. For more details about all Pix4Dfields features, check out the product feature list. |