Mapping the Kilauea volcanic eruption with drones
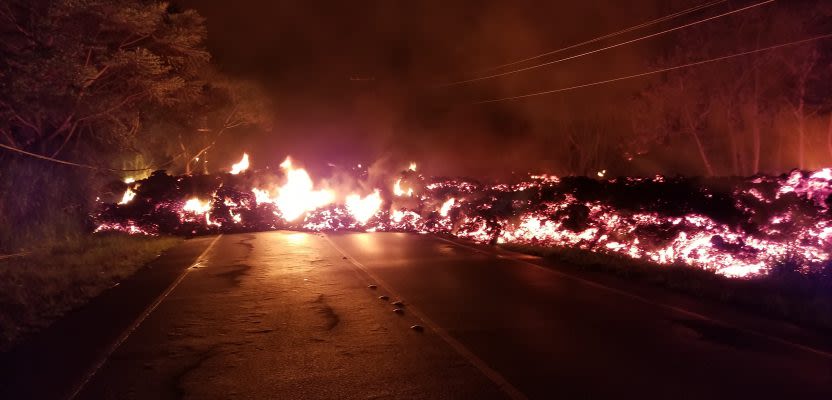
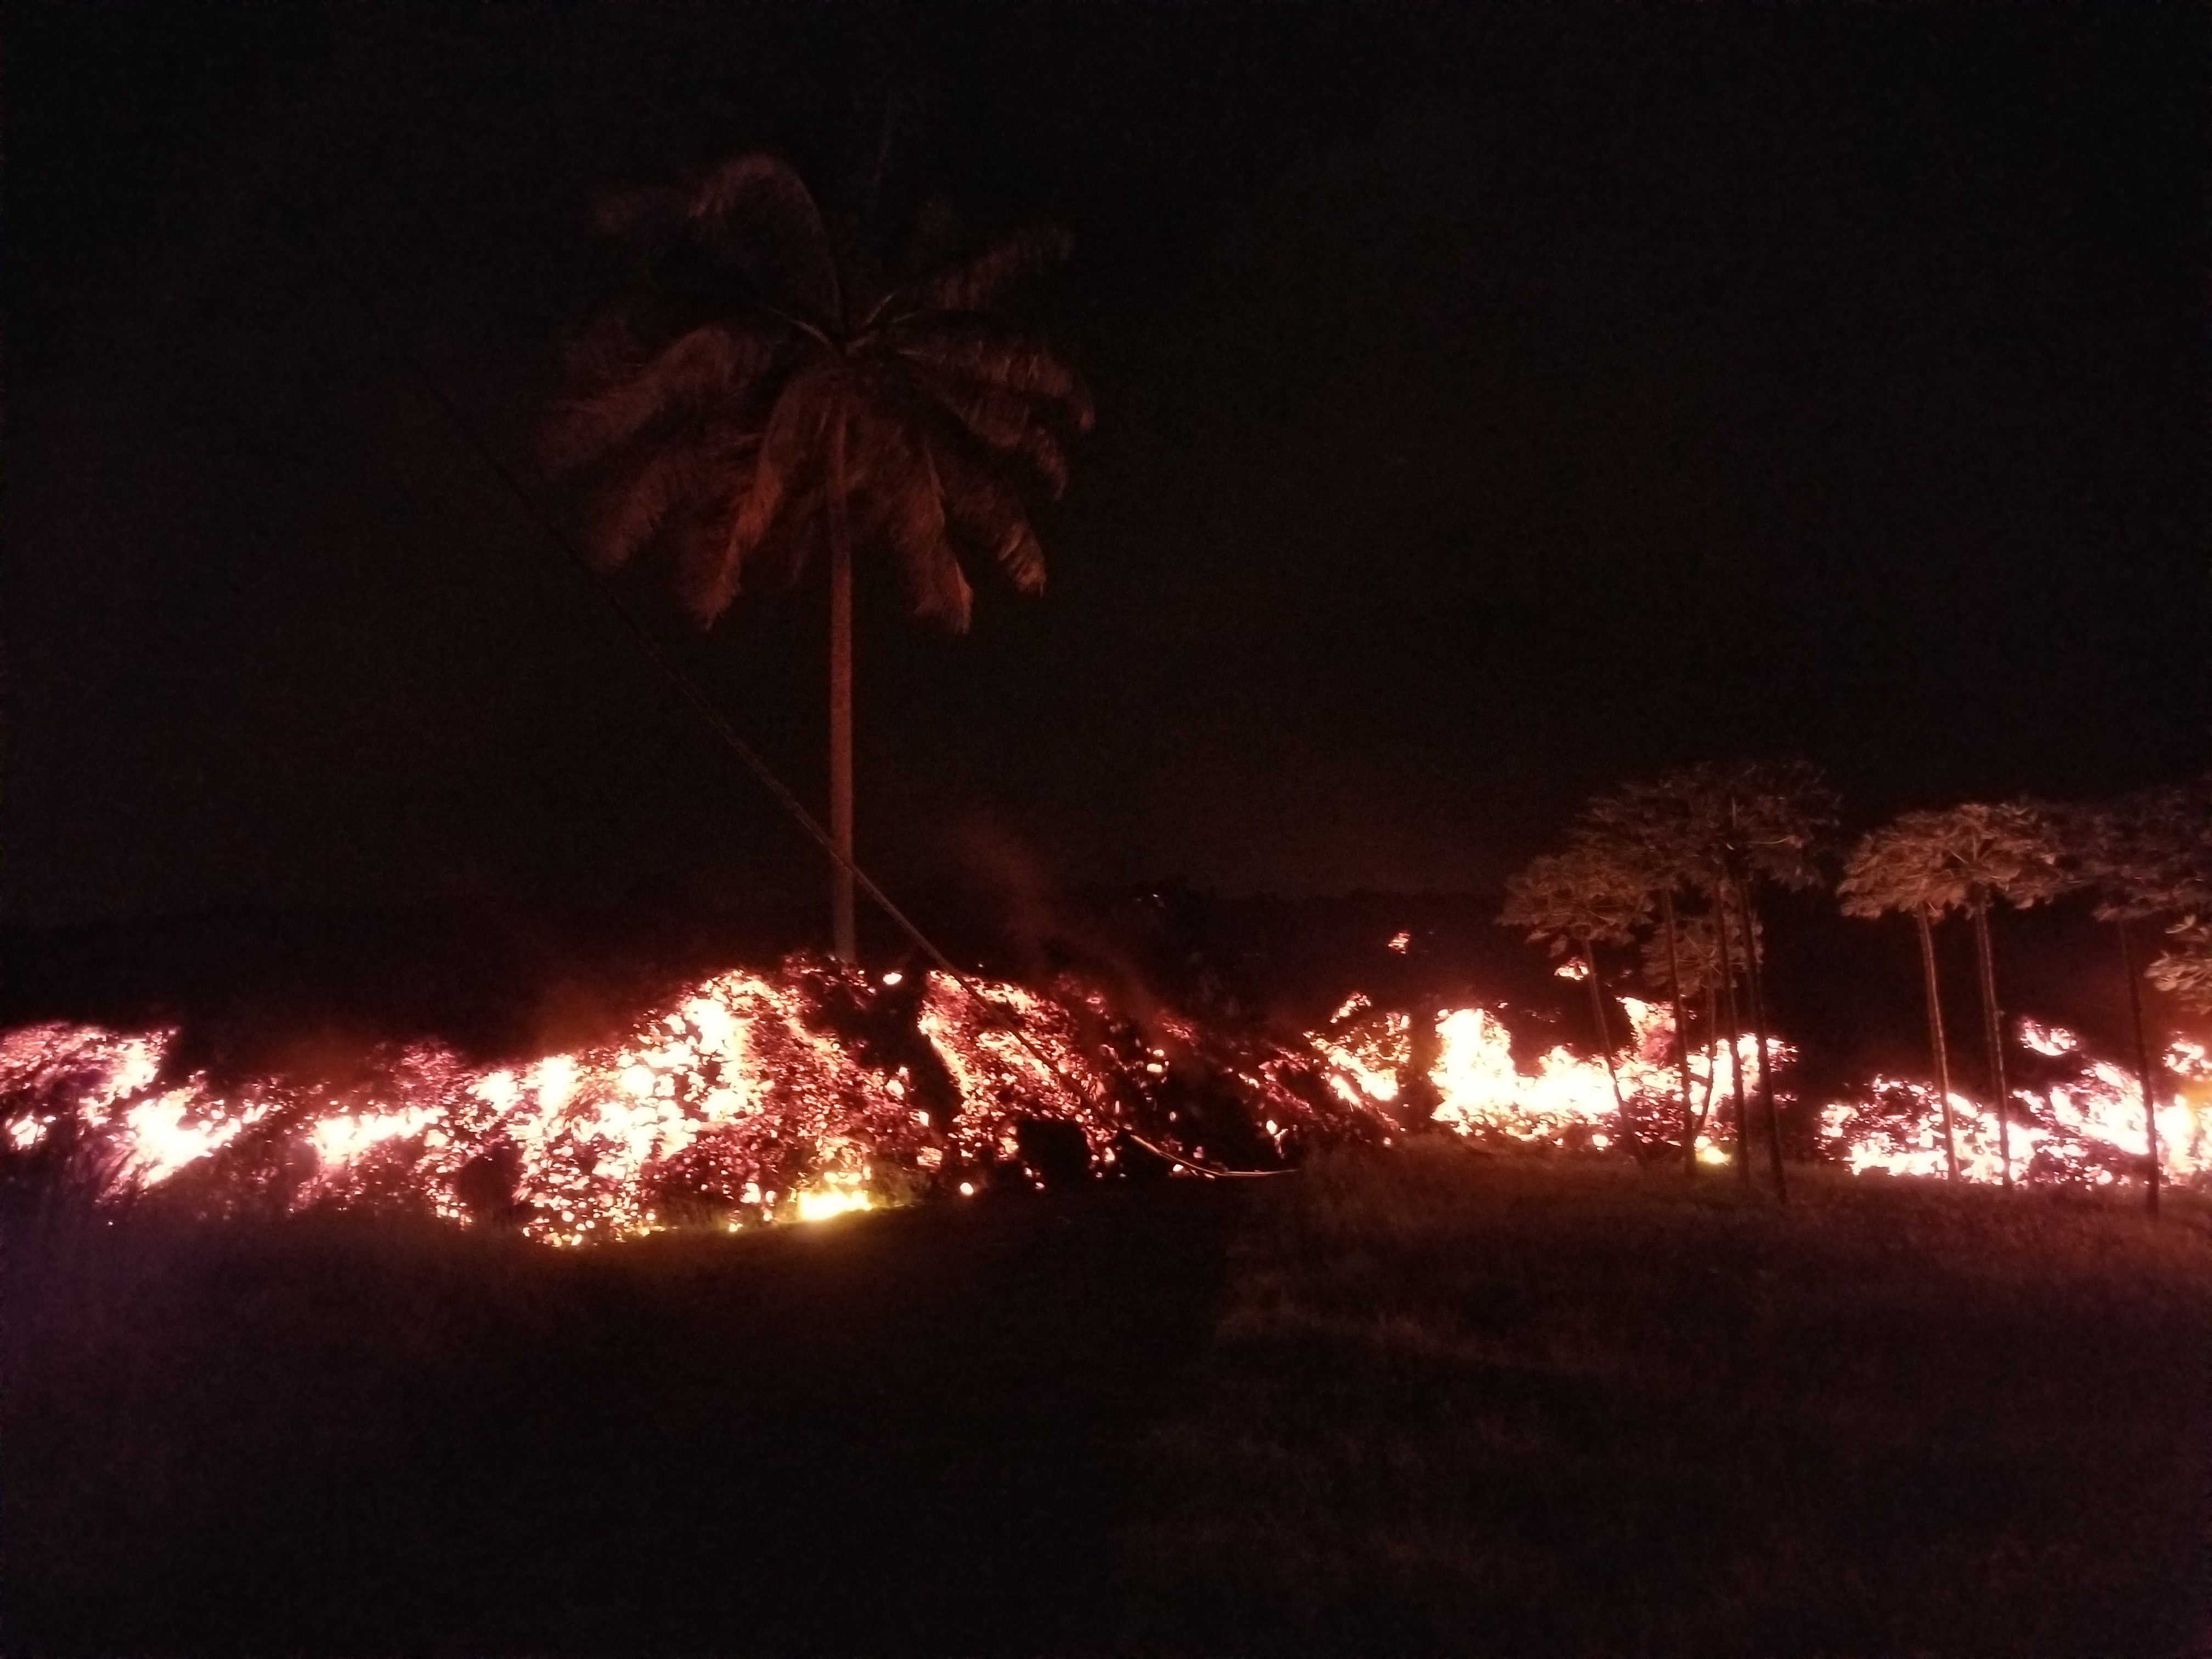
In early May, 2018, Hawaii’s Kilauea volcano erupted, opening more than a dozen new lava fissures in the surrounding rural communities as the Big Island shook with the state's strongest earthquake since 1975.
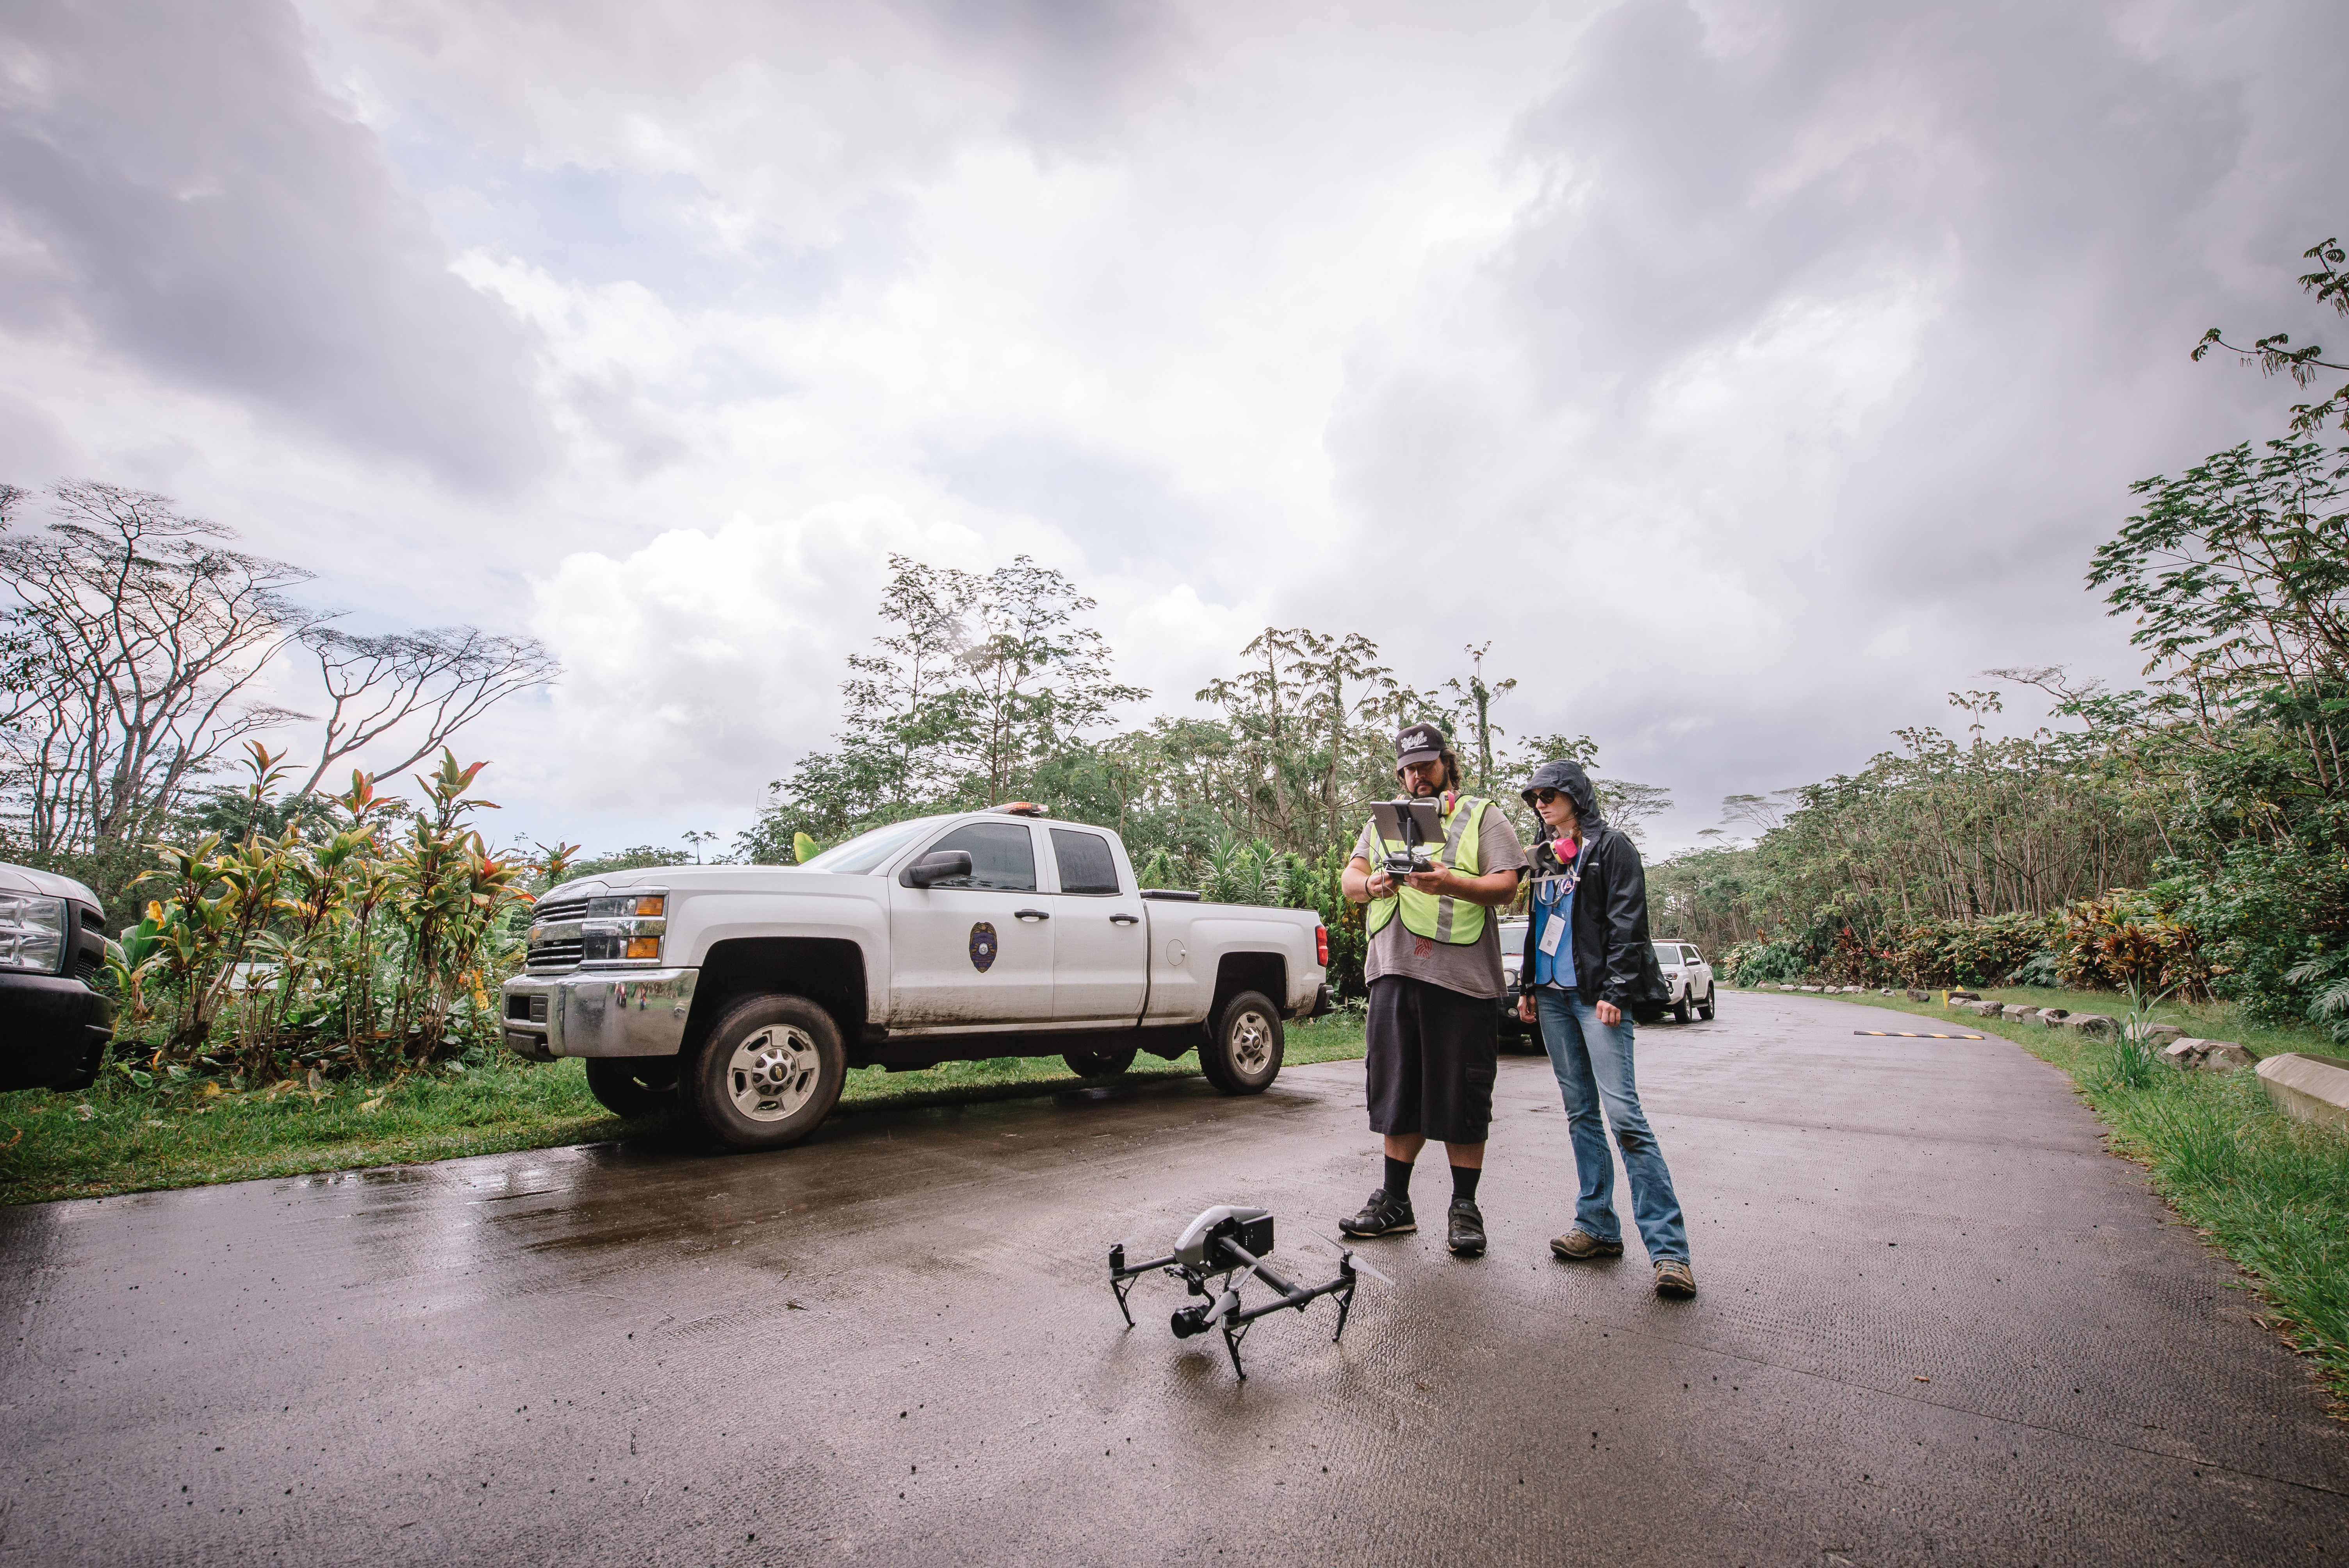
Forewarned of a potential eruption by reports from the USGS and unusual seismic activity, Dr Ryan Perroy from the University of Hawaii at Hilo (UH Hilo) and his team of students and staff were ready to map the lava flow and help mitigate the effects of the disaster if called upon.
Within a day of a lava fissure appearing in Kilauea’s rift zone, the team had a drone in the air, providing maps and imagery to emergency response teams at the request of Civil Defense.
The emergency management team
A disaster affecting so many people and so much infrastructure requires a diverse team and involved agencies and institutions at the Federal, State, and local levels. As the eruption entered its second month, Frontier Precision’s Nathan Stephenson, an applied geospatial engineer based in the company’s Denver office, flew out to support UH Hilo’s aerial mapping component of this effort. Stephenson worked closely with Dr Perroy’s UH Hilo team, assisting the USGS and Hawaii County Civil Defense.
It wasn’t Stephenson’s first visit to the island - or his first time mapping lava flows. As a graduate student at the University of Hawaii, Stephenson collected data on a 2014 eruption.
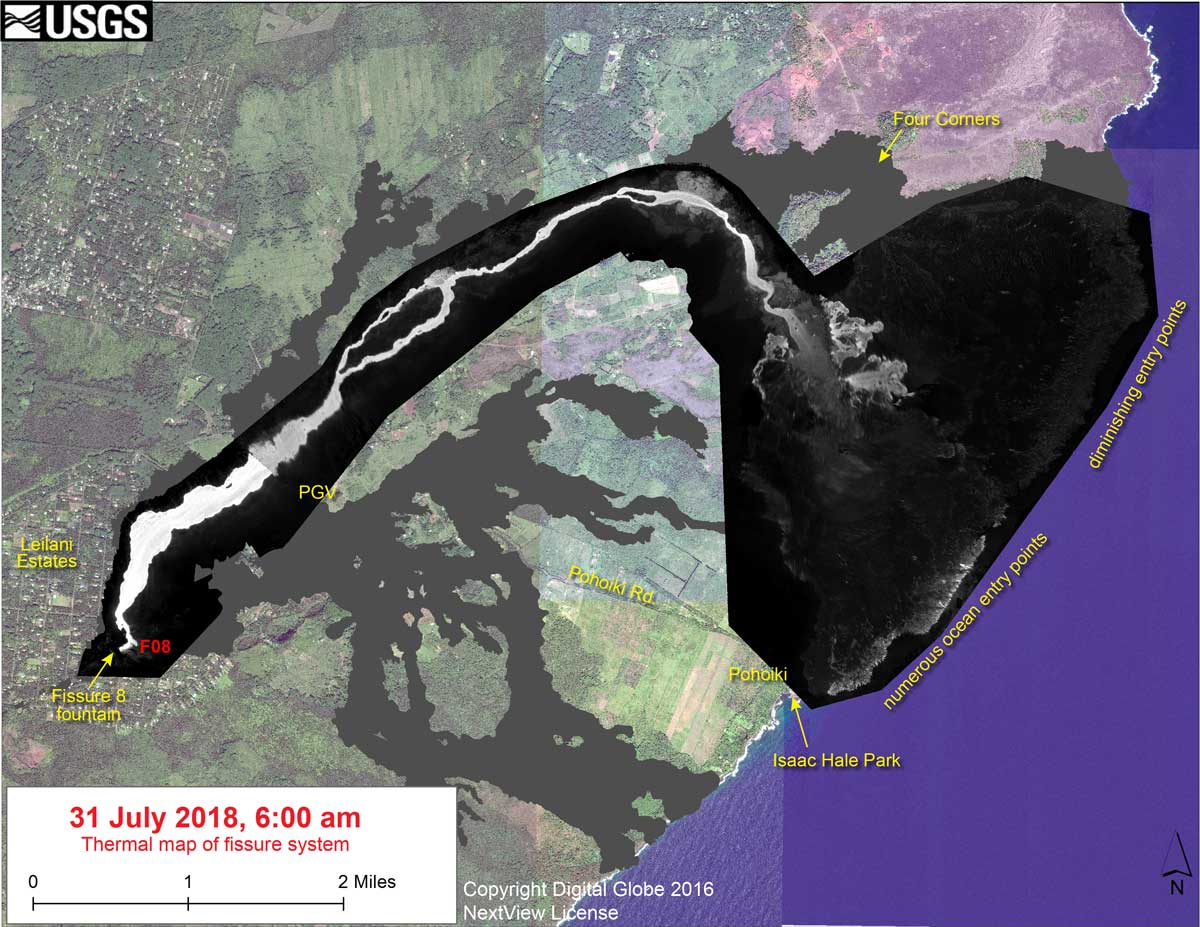
“One thing we have now that we didn’t have in 2014 was a thermal radiometric camera that helps us map more accurately at night and enables us to capture large heat signatures,” says Stephenson.
Predicting the lava flow with drones
Lava erupting from a fissure can reach 1,200 degrees celsius. With a thermal camera, heat signatures from lava seeping just below the earth can be detected, providing insights of future activity.
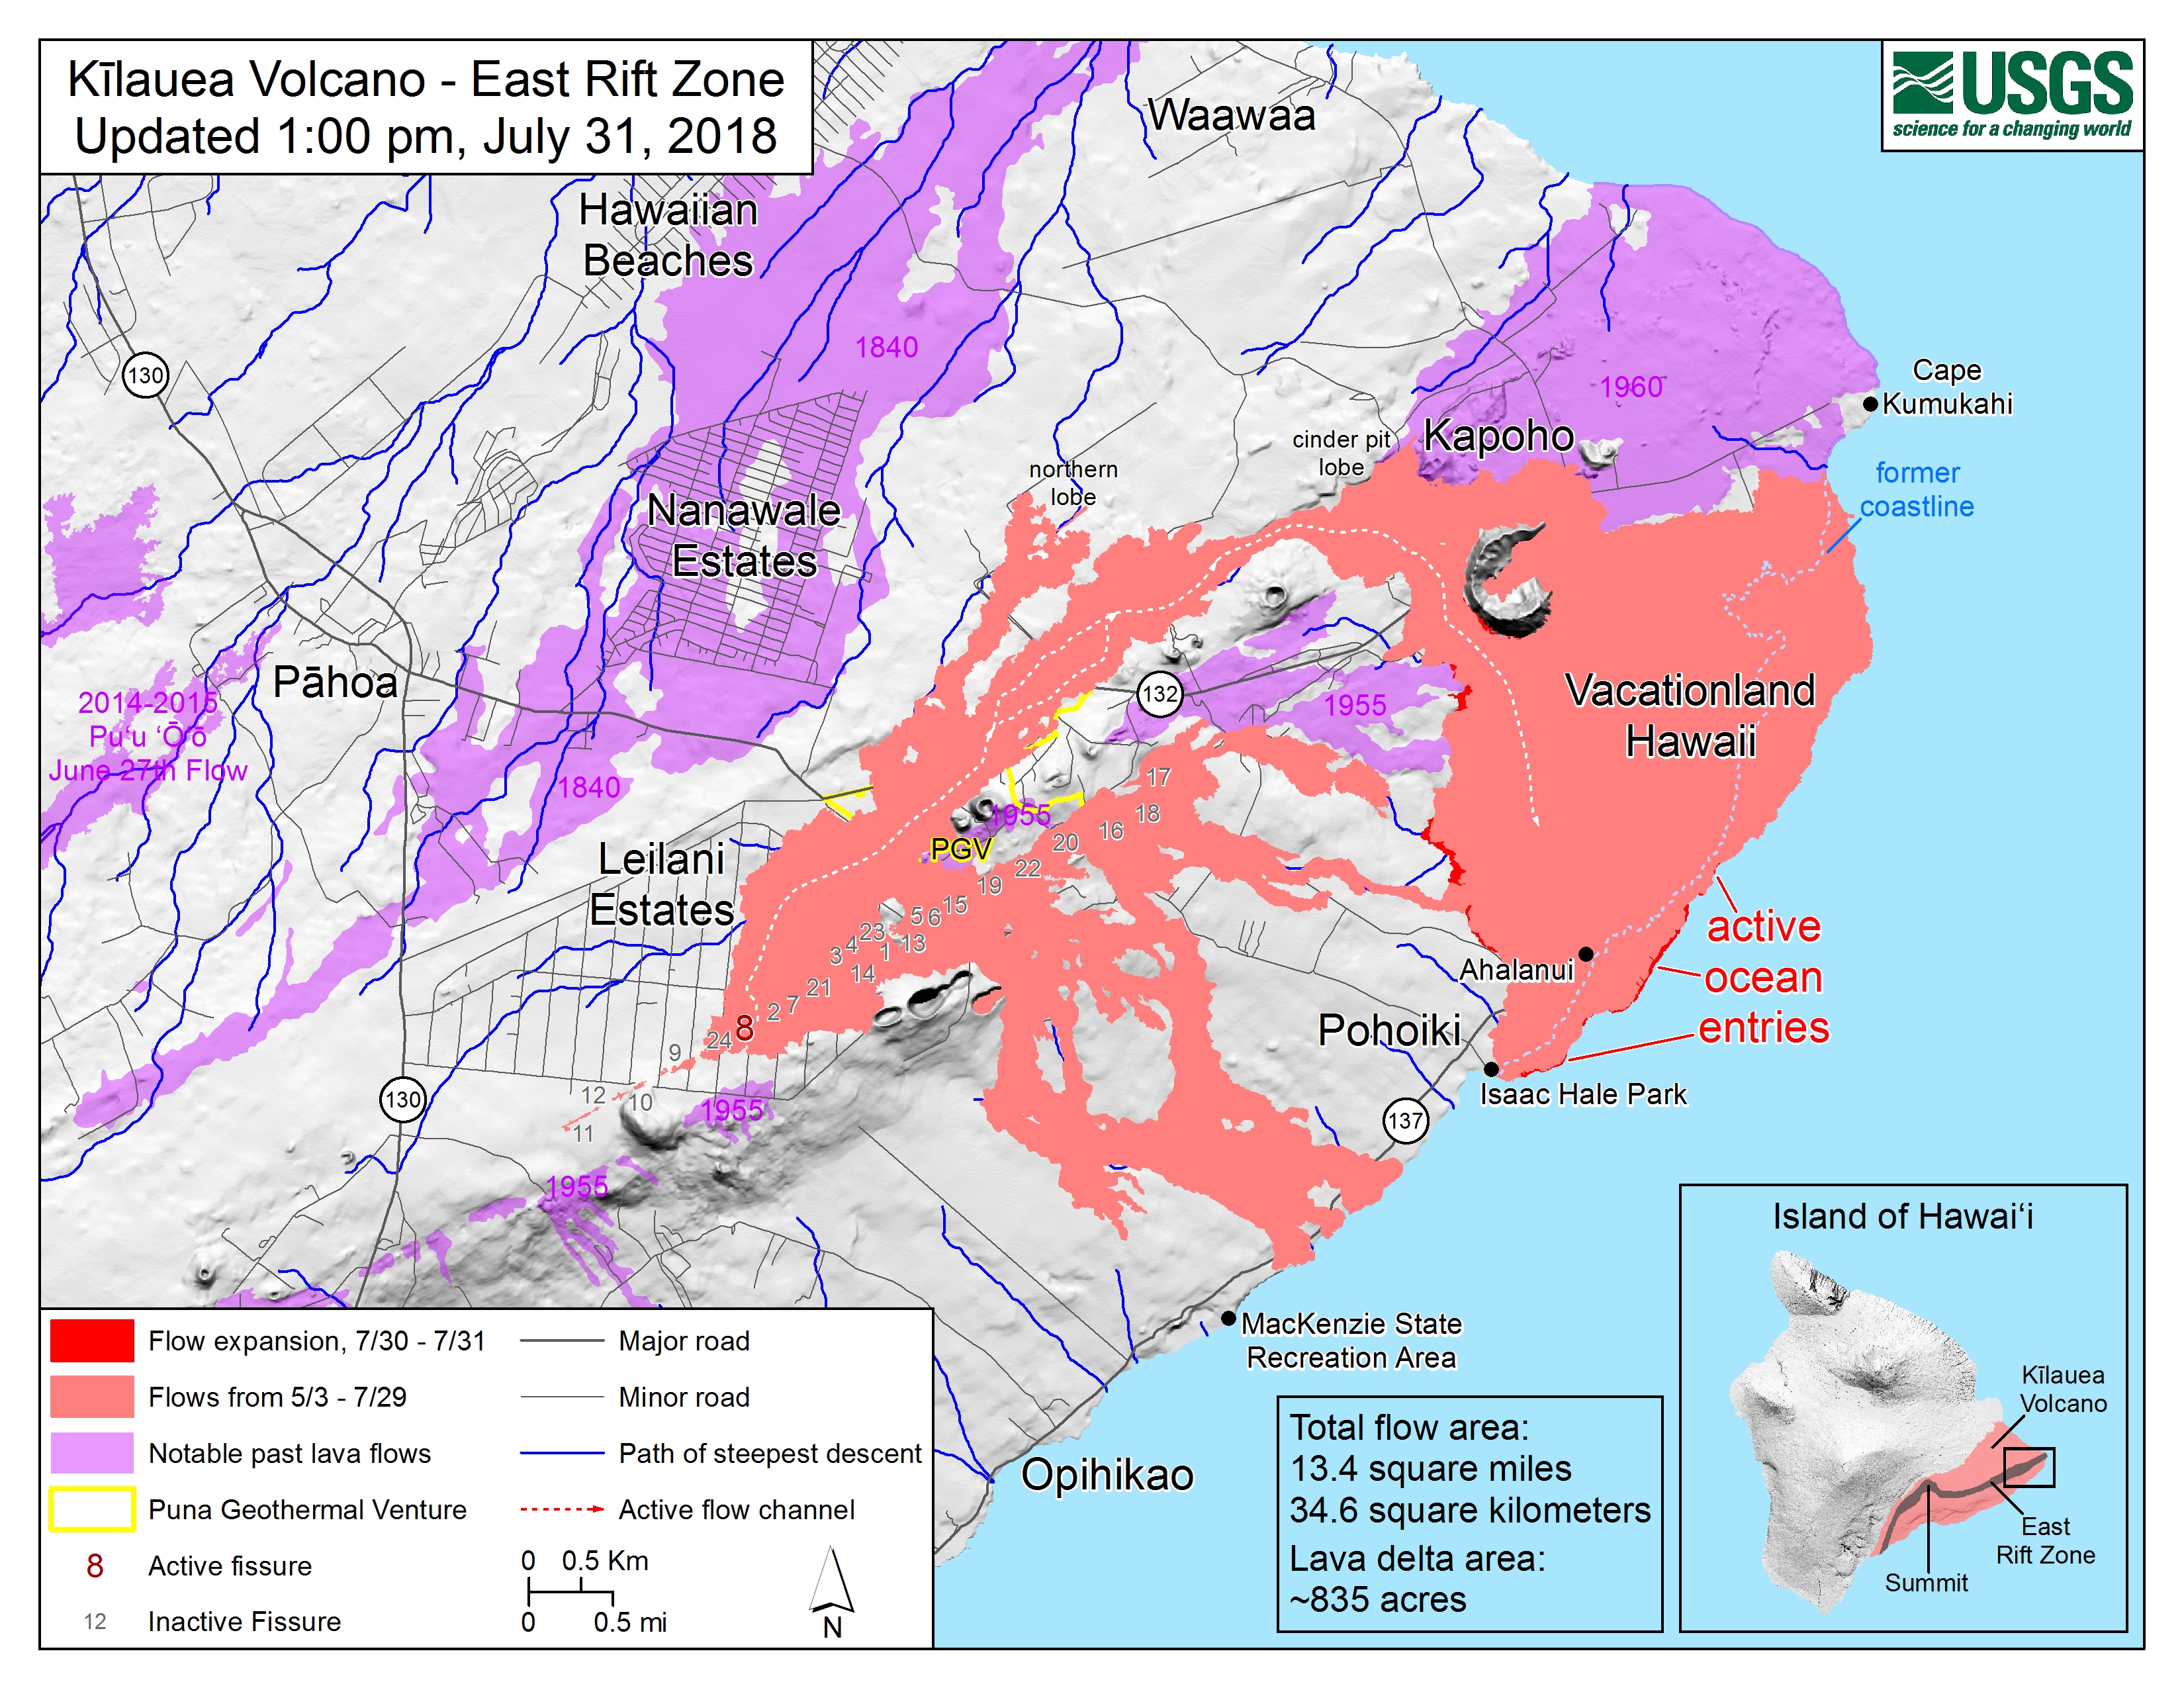
Dr Perroy and his UH Hilo Spatial Data analysis & Visualization (SDAV) research lab were tasked with mapping the lava fissures in relation to infrastructure, roads and houses around the rural community of Leilani Estates, in the Lower East Rift Zone.
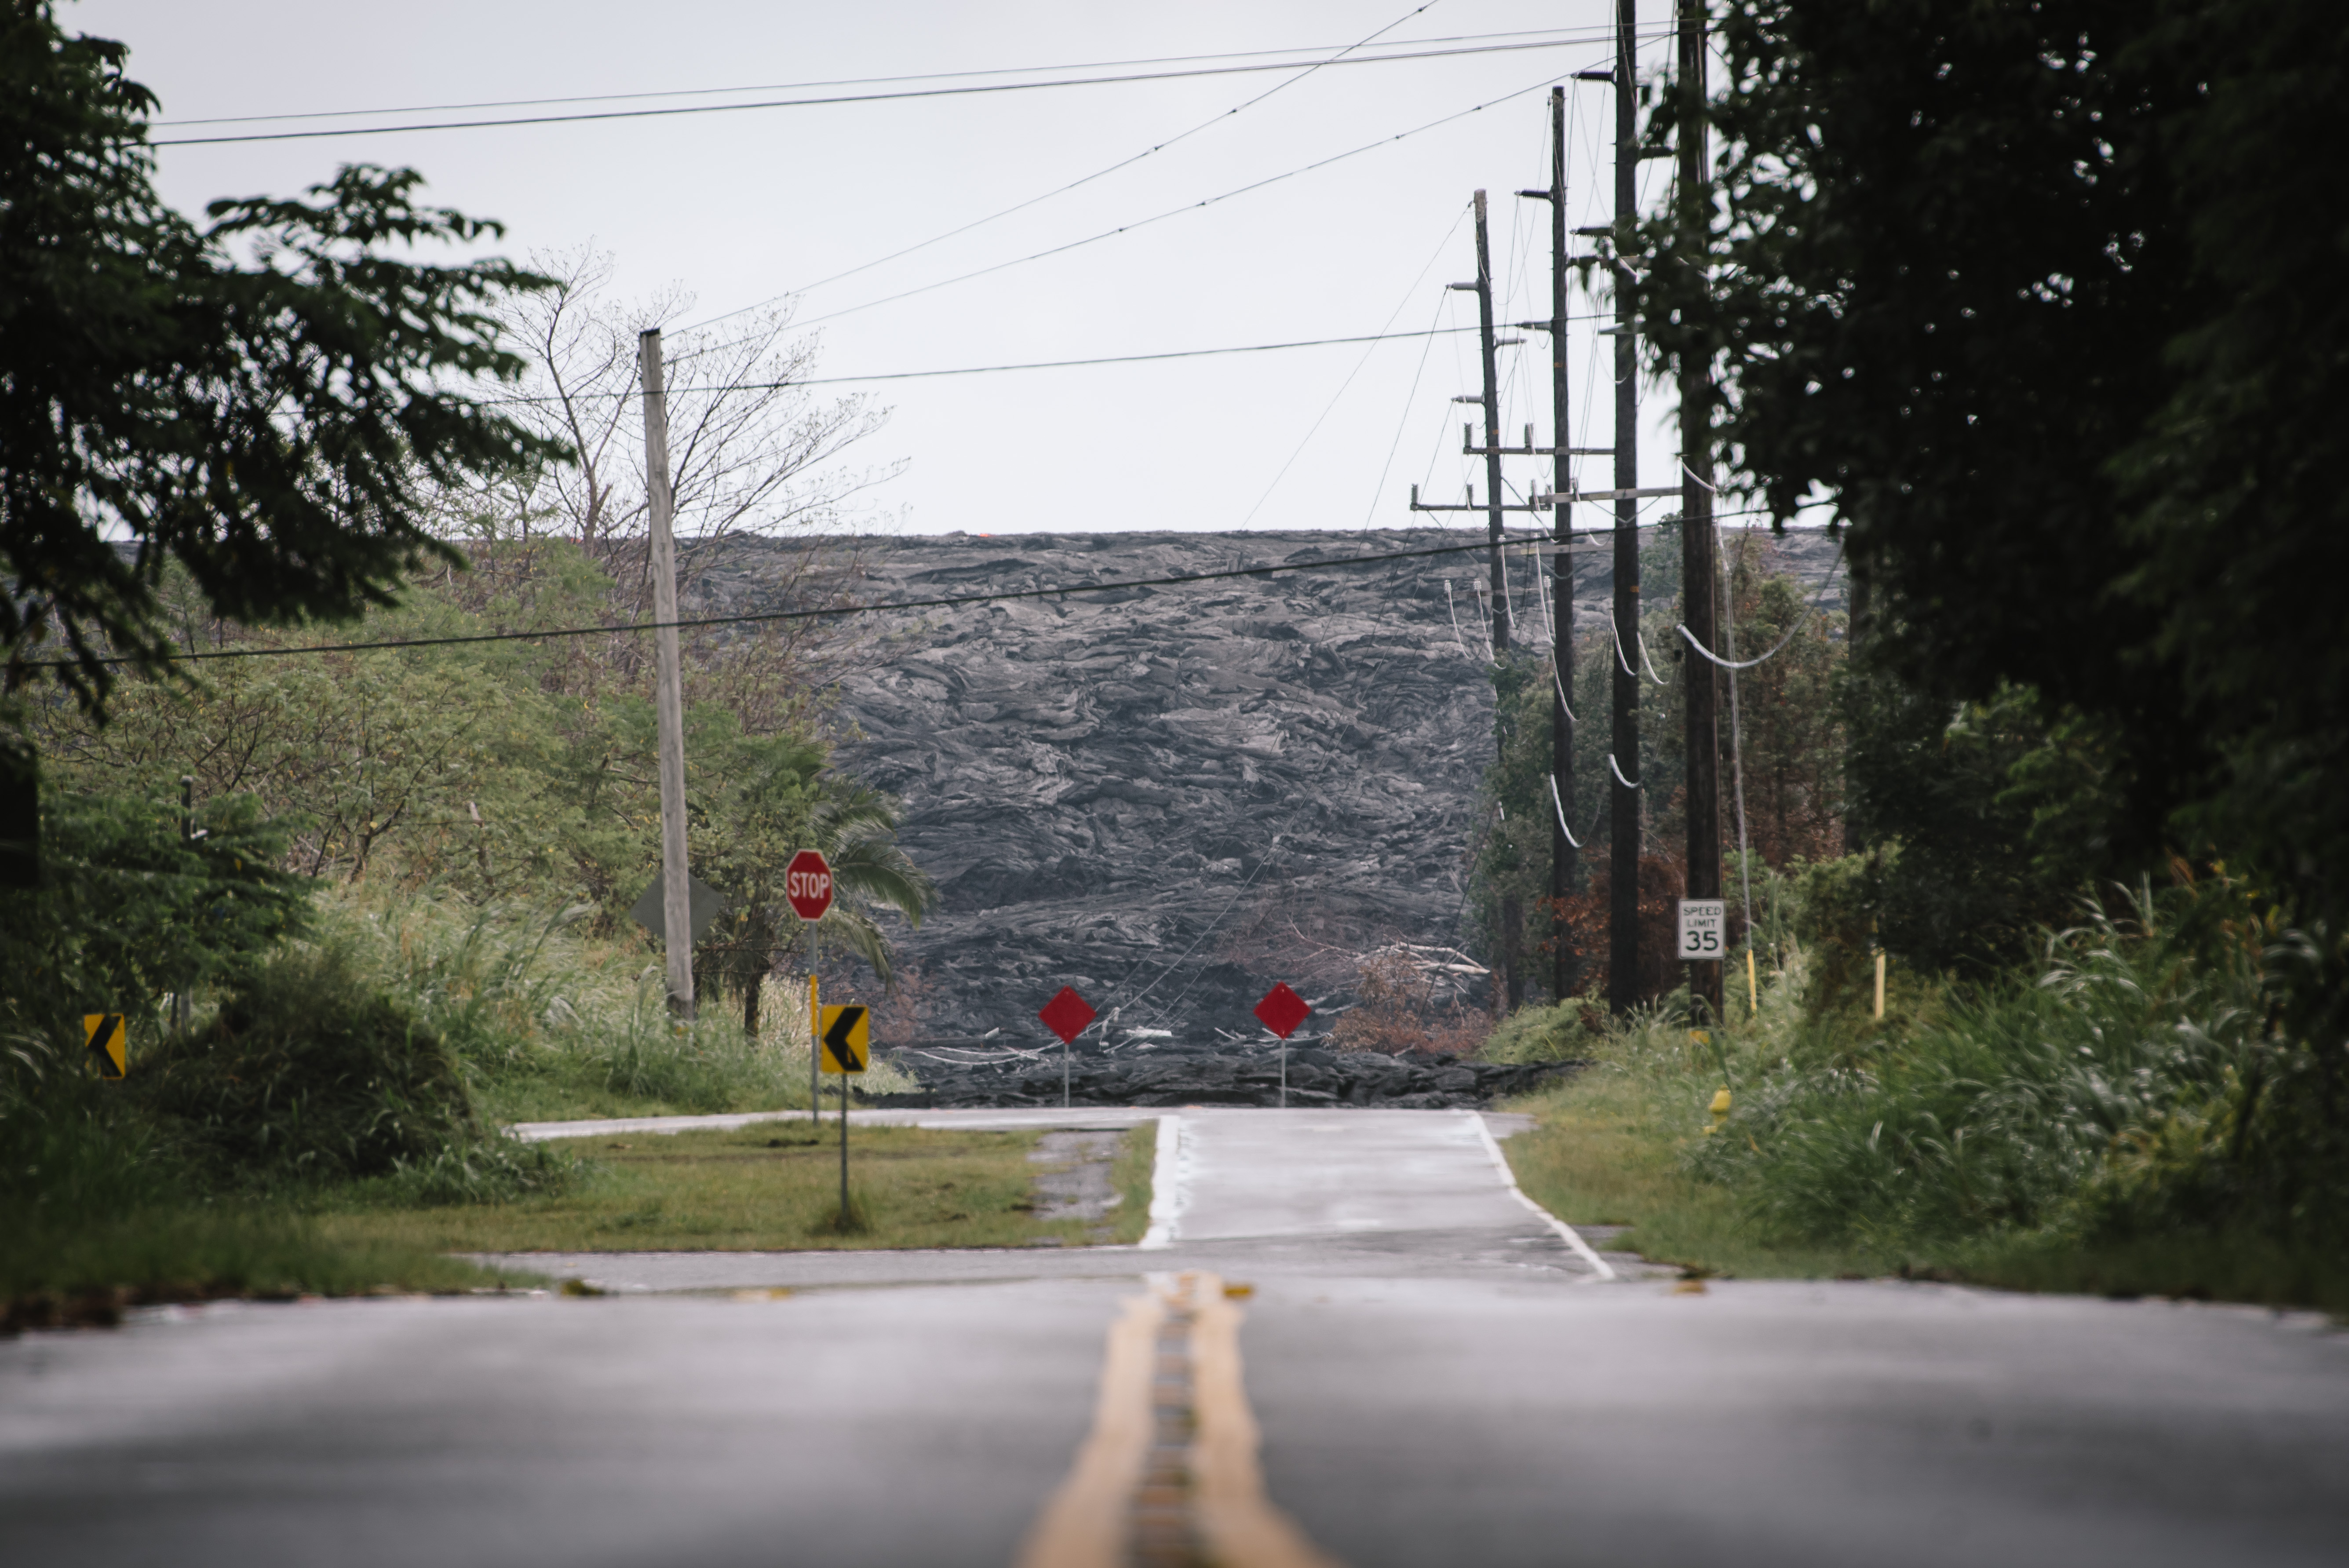
One key section of highway was monitored closely: “If they had to close this one road, it would have made the evacuation area much, much larger,” explained Stephenson. “Every night or so we would go back, and the road would be hotter and hotter.”
Cracks and steam appeared in the surface of the road, but the community was lucky - despite predictions, a fissure did not erupt. The road remained open to traffic, the cracks were eventually bridged by thick steel plates, although the area was closely monitored.
Thermal mapping at night using drones
“I was only in Hawaii for about two days before we began to only fly at night,” says Stephenson. “As soon as the lava appeared airspace was closed to non-essential traffic - there were no pleasure craft or tourists in the local airspace - but there was still a lot of air traffic.”
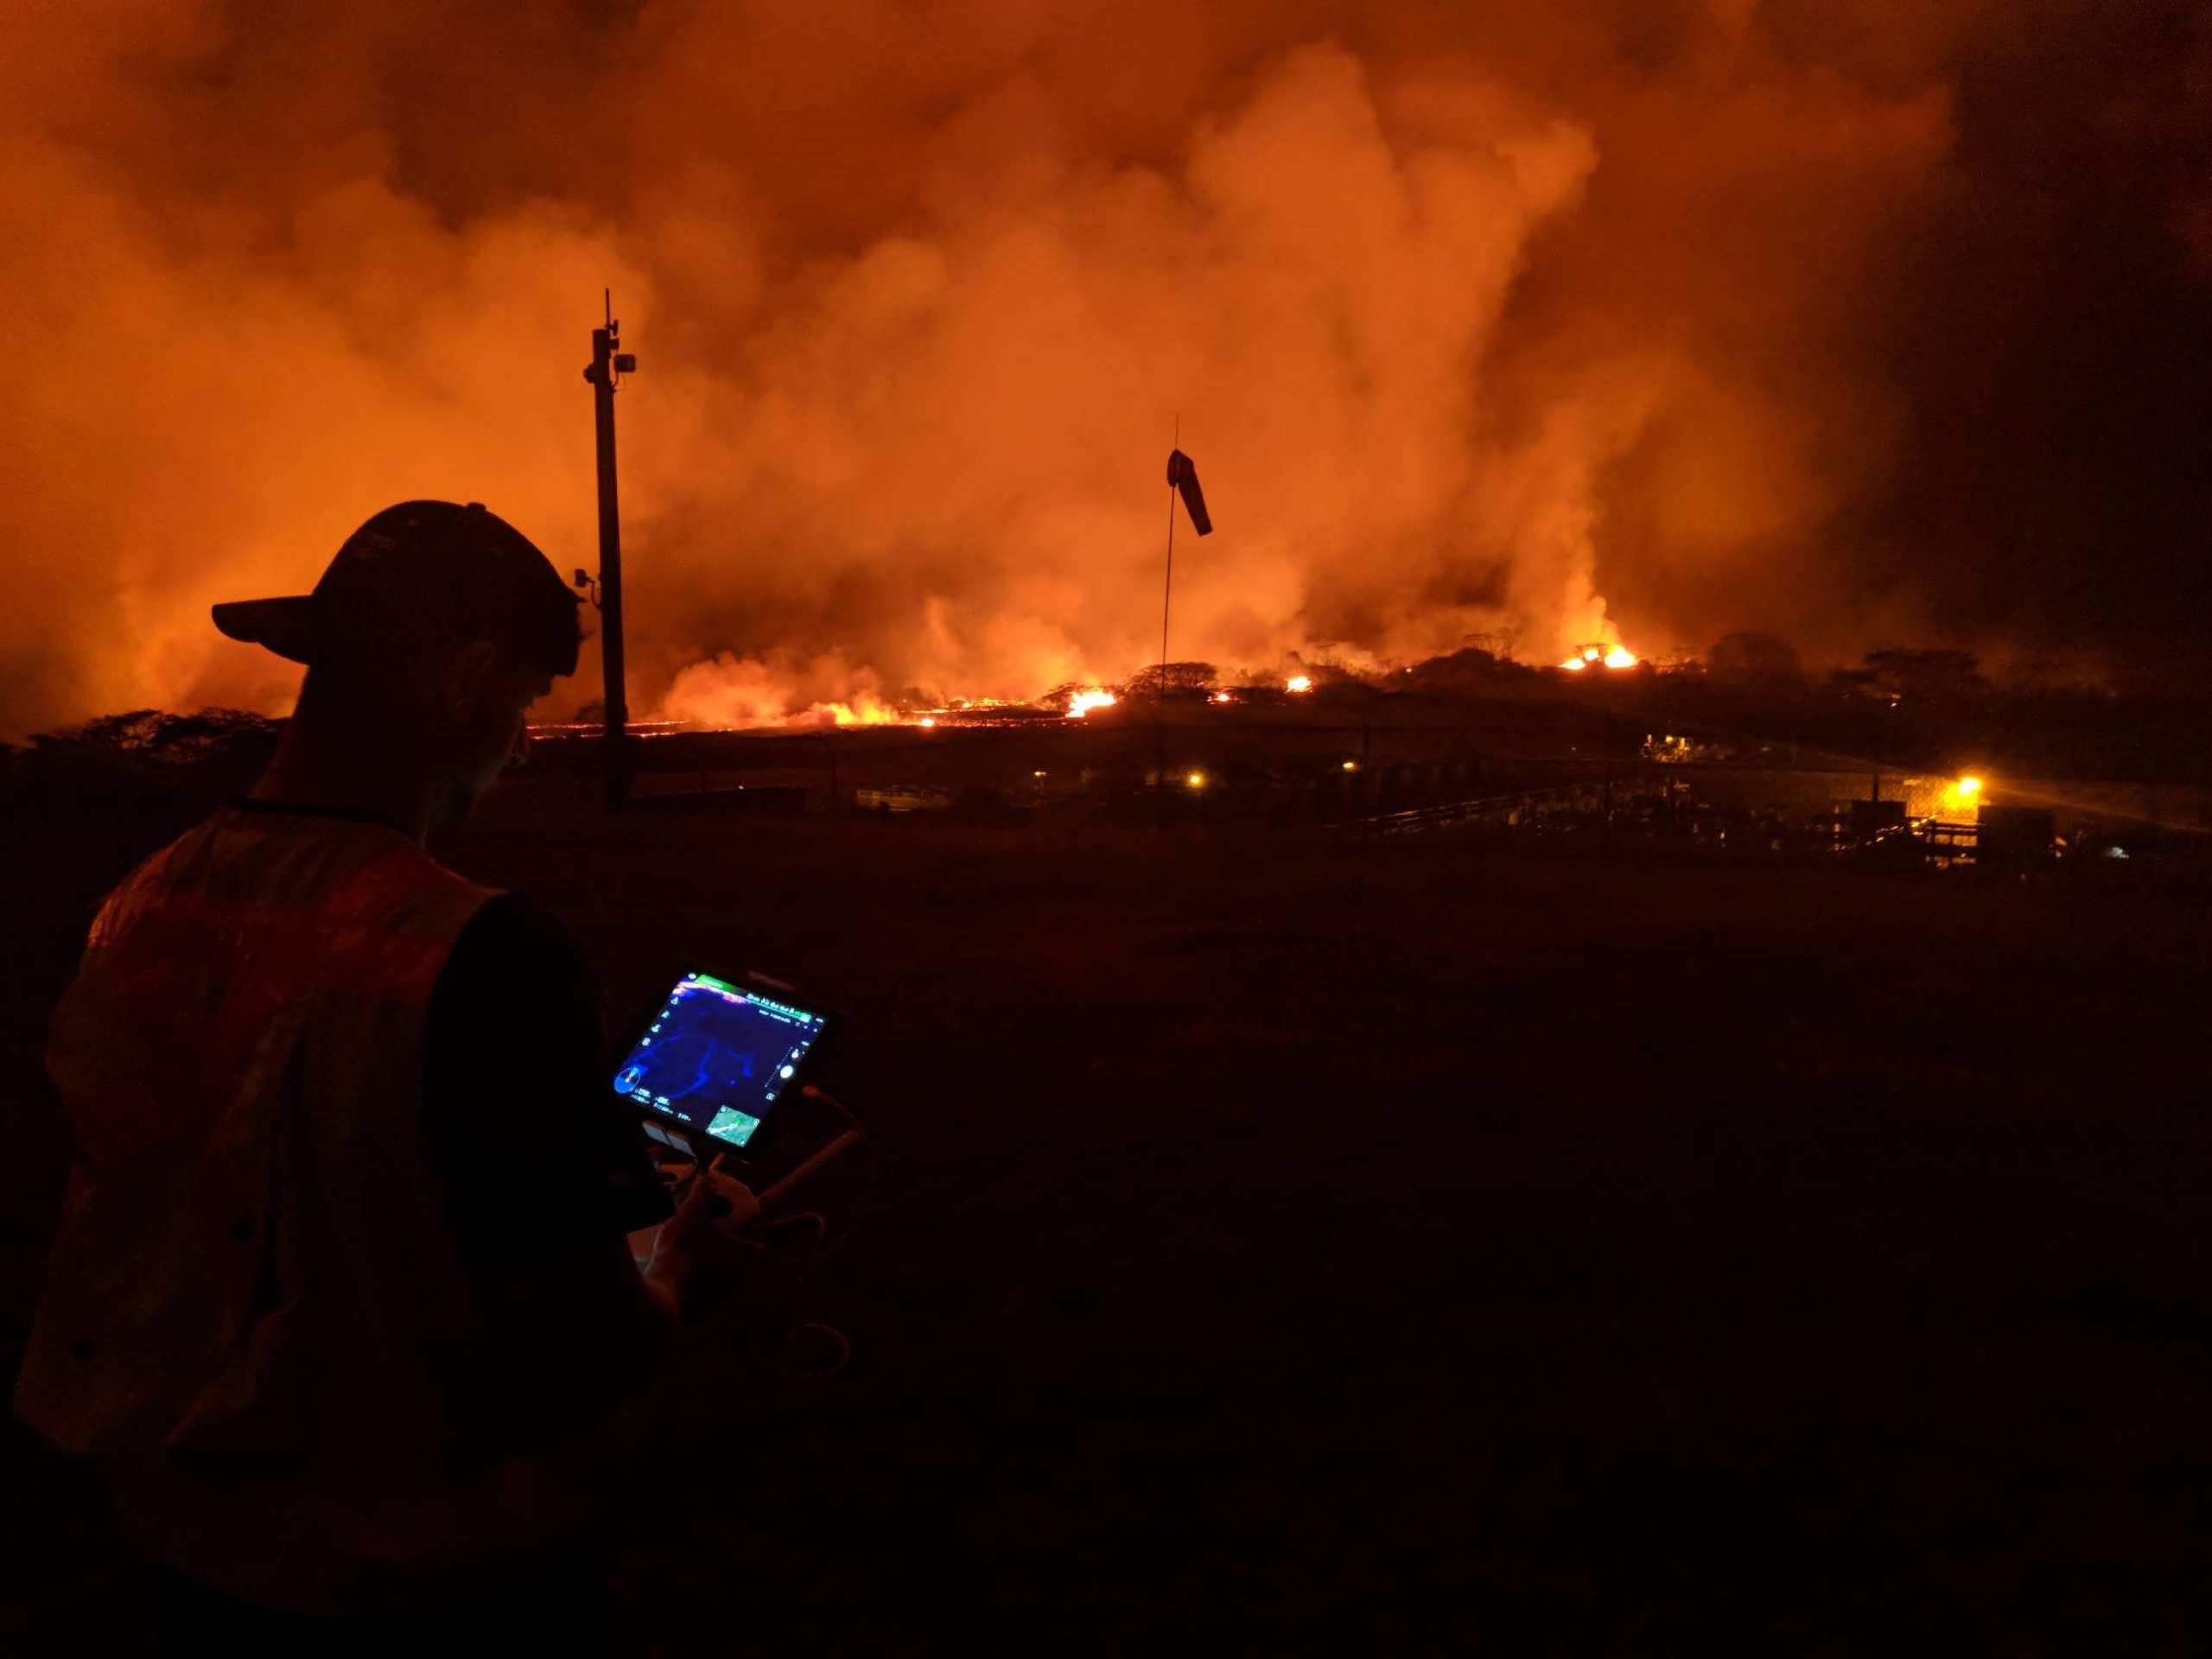
The UH Hilo team received special permission from the FAA to fly at night and higher than usual - 305 meters (1,000 feet) instead of the typical 122 meters (400 feet). This was well above the matter shooting out from the Kilauea volcano fissures. The higher altitude also meant that fewer images were needed to cover the same area, allowing teams to capture data faster.
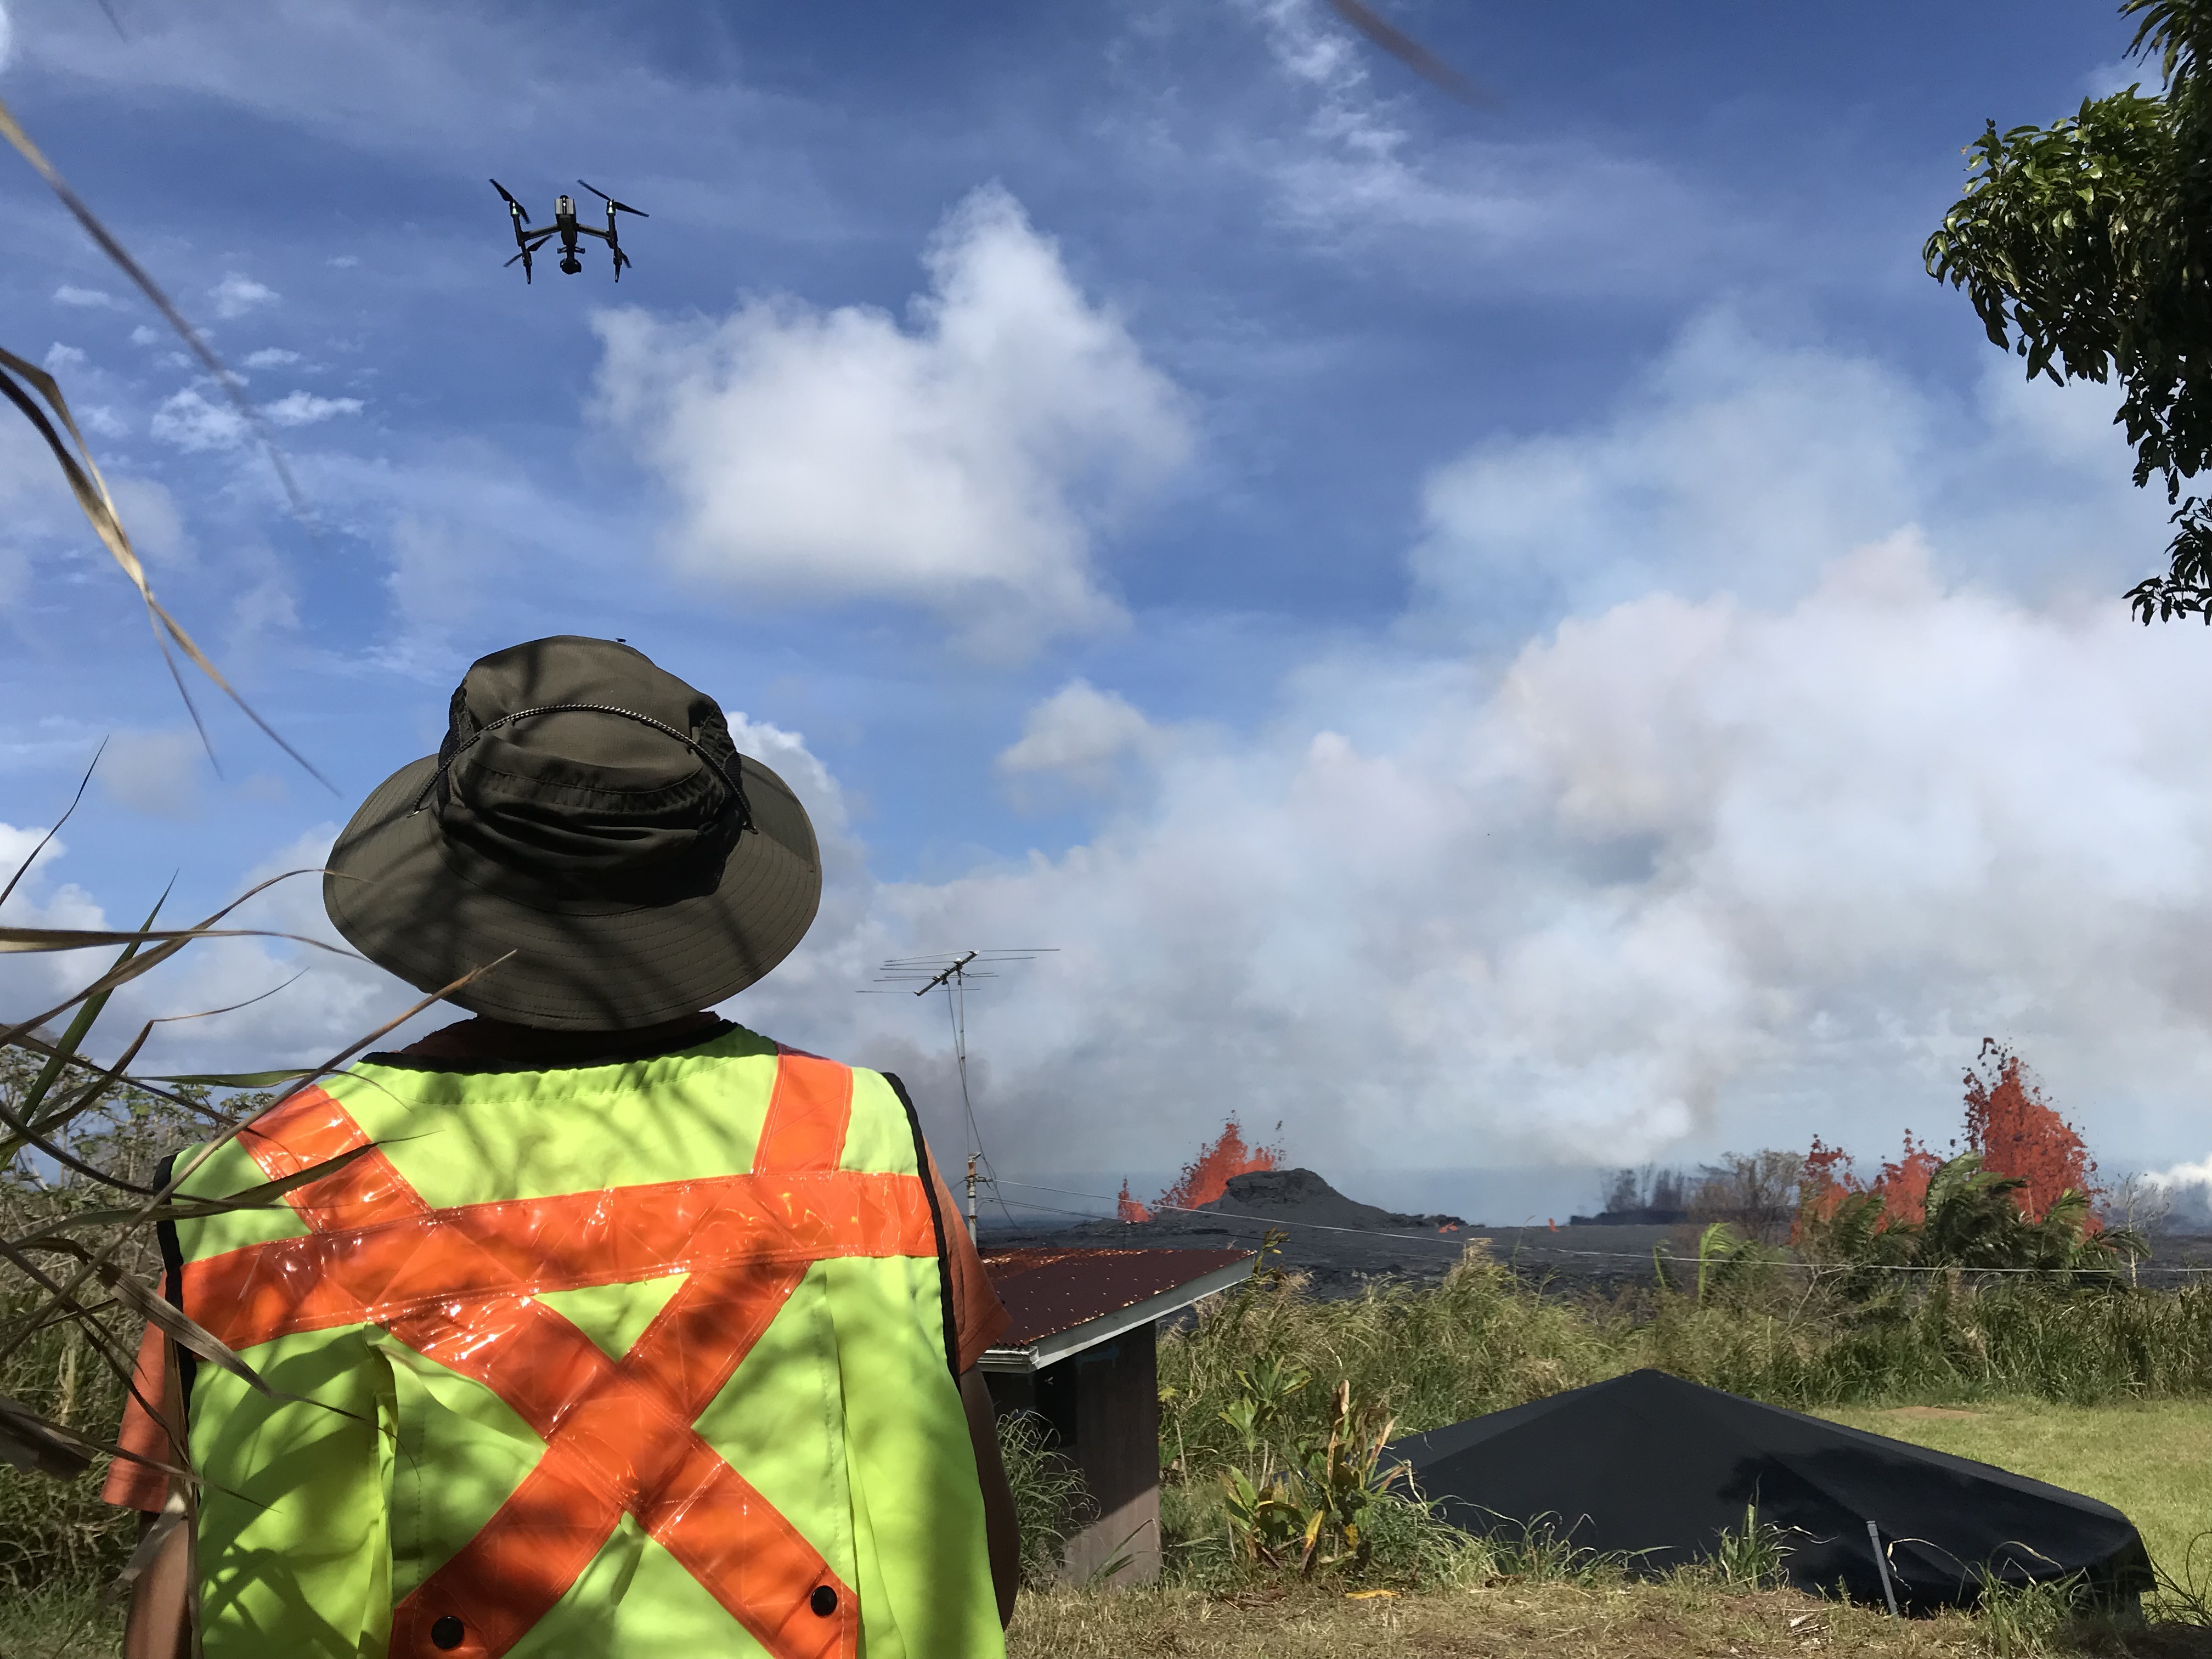
Lights were attached to the fleet of DJI Inspire drones making them visible at night for three nautical miles. As well as meeting the legal FAA requirements, this also made the drones visible to the team.
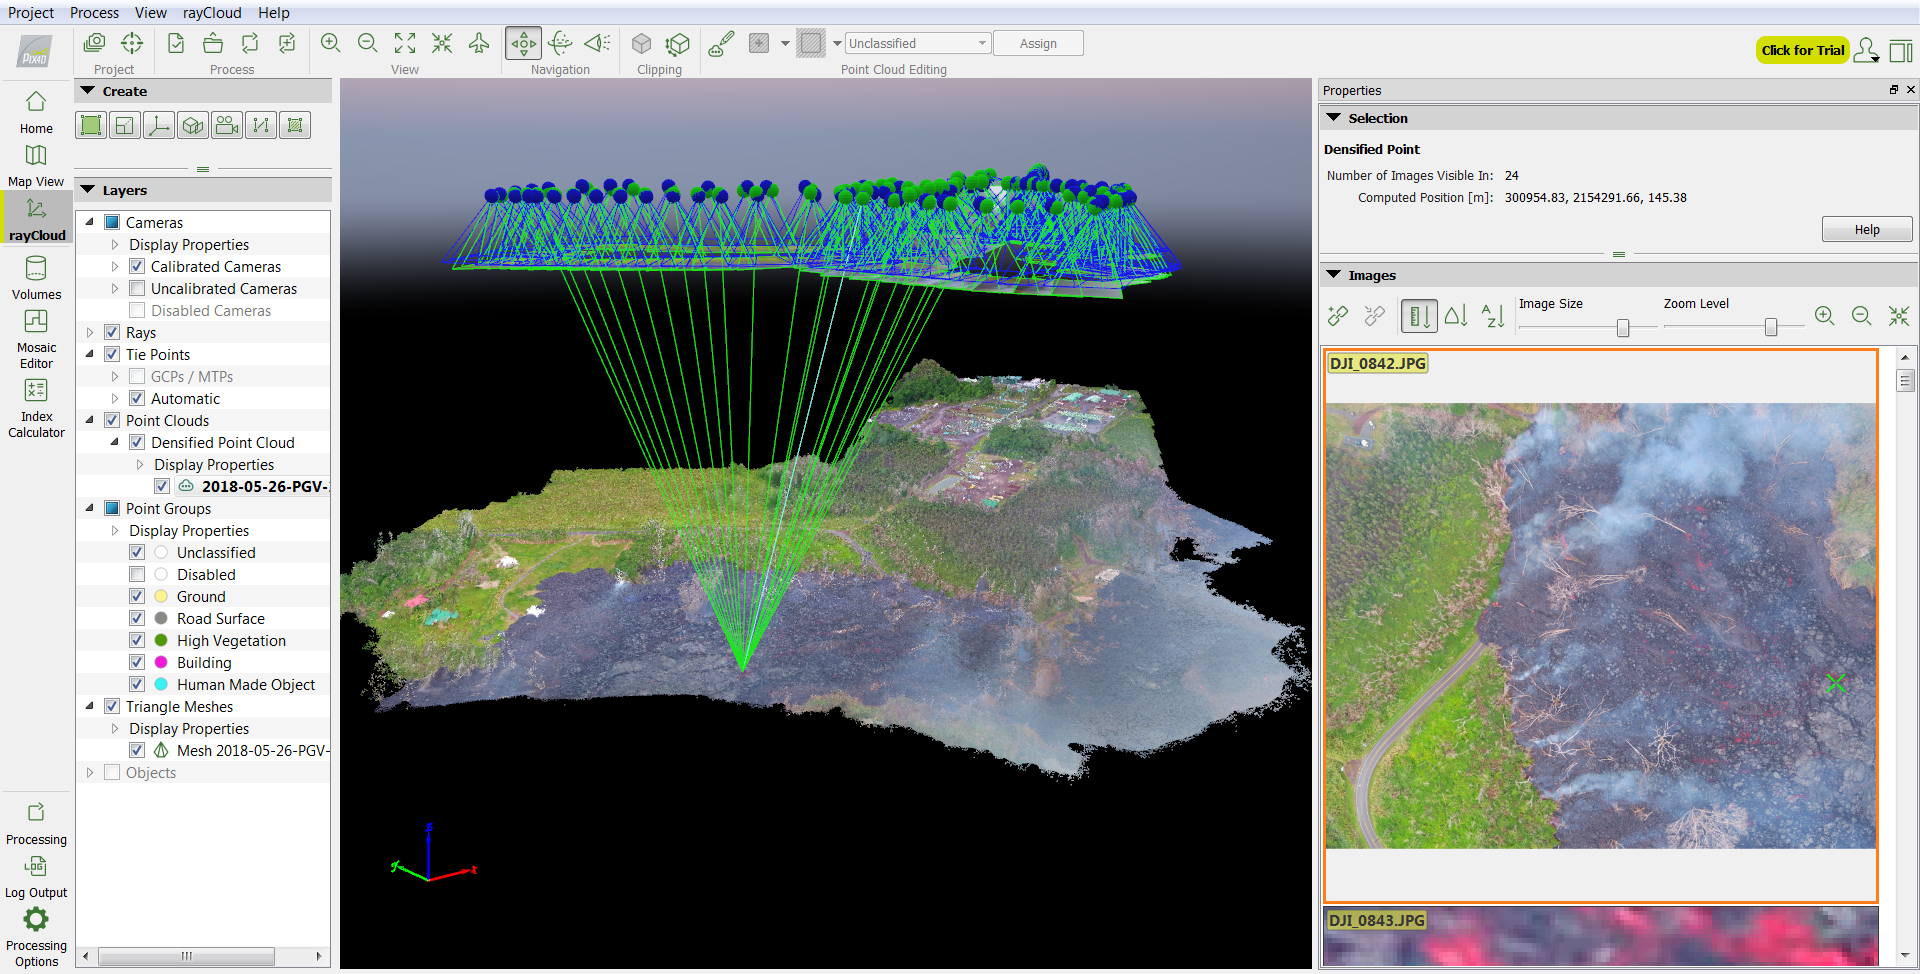
As well as being safer, the team found that using thermal images their results were more accurate. To create accurate maps and models from images, Pix4D mapping software relies on finding commonalities between images - the same point in more than one picture. Images which contain large amounts of black, for example, photos taken at night, or photos of cooled lava, are difficult for the software to reconstruct, while the heat signatures show up clearly.
The night watch
Stephenson and the UH Hilo team were often the only ones watching the lava from the air during the nighttime hours.
“There were boots-on-the-ground teams always watching to ensure the lava didn’t sneak up on a community overnight,” says Stephenson, “But in terms of monitoring the lava from the air - what direction it’s moving, how fast it’s moving - initially that wasn’t being monitored at night by anyone aside from us.” Eventually, the USGS and the Department of the Interior brought out their own drone teams and they also flew missions at night.
These drone teams were a key resource, and the information they gathered was used by the authorities to decide whether to move roadblocks or close roads.
Mapping vital infrastructure threatened by disaster
The Puna Geothermal Venture, or PGV, generated 25% of Hawaii’s power. It also sat directly in the path of the lava, which was flowing in a straight line, directly towards the powerplant.
As PGV employees shut down equipment and shifted the stock highly-flammable pentane to a safe location, the UH Hilo team had drones in the air.
Project details
| Location | Puna, Hawaii, United States |
| Hardware | DJI Matrice 200, Inspire 1, and Inspire 2 drones DJI Zenmuse XT and XT2 thermal cameras DJI Zenmuse X5S and X4 visible cameras Trimble R10 and Trimble R8 GNSS Systems |
| Software | Pix4Dmapper photogrammetry software, ESRI ArcMap |
| Flight time | 10-30 minutes per flight |
| Processing time | 15 to 20 minutes with rapid processing mode |
“We’d fly every single day,” says Stephenson. “A normal flight would only take ten to twenty minutes, and in the downtime we would move to the next location and process the data on a gaming laptop in the field.”
Using Pix4Dmapper’s rapid processing mode, the team got results in under twenty minutes. Rapid processing mode is less accurate, but had plenty of detail for the team: “In this case, it didn’t matter if we were a few feet off. We could see where the lava was moving, and how much it’s moving,” Stephenson said. “We could see if the lava was expanding at the front, for example, which is usually indicative of it slowing down. Or, we could see if it was channeling, which means it was about to move really fast.”
Ground control points are one of the best tools to ensure a high quality reconstruction. However, the team found they couldn’t always rely on them.
“In order to lay useful ground control points, we had to predict which way the lava was going to go - which sometimes worked and sometimes didn’t,” explains Stephenson. If the team did get it right, the ground control points would often be swallowed by the lava they were trying to measure.
“The other big issue was the ground itself,” continued Stephenson. “There were so many earthquakes, and that meant the entire landscape moved. So even if the ground control points survived, we’d go back in and check its coordinates, and find that the coordinates themselves had changed.”Using a wifi hotspot, the team would upload the results to a shared dropbox, where it could be accessed by emergency management teams including USGS, Civil Defense, the Fire Department, and the mayor’s office.
As the lava crept towards PGV - sometimes moving as much as a 30 meters (100 feet) in an hour - the team flew day and night, calculating and recalculating when the lava would reach the power station.
“We would overlay the orthomosaics over ESRI basemaps and county road maps. We’d stack them throughout the hours and show the position of the lava at 10am, 11am, 12pm,” says Stephenson.
“It took a lot longer than we expected, but the lava did eventually touch the power plant, destroying maybe 10% of it.” Stephenson continued. “Then interestingly enough, it split left, then split right and went around it. It totally surrounded the power plant and created a river on the other side.”
In the lava zone
As the eruption event rolled into its fourth and final month, keeping the team safe was a constant concern. After working seven days a week for months, the team was in danger of becoming exhausted. Roads had been destroyed, making the disaster zone difficult to navigate. Previously safe areas could become dangerous in a heartbeat.And lava can move faster than a person can run.
To mitigate some of the dangers of the lava zone, the team relied on good equipment and good communication.
The team were equipped with sulfur dioxide detectors which warned them to put on their gas masks if the toxic gases reached dangerous levels. They carried fire radios which (when signal allowed) let them communicate with the fire department. The fire department coordinated entry and exit into the lava zone, ensuring all personnel were accounted for, and an informal network of ‘boots-on-the-ground’ people from different agencies shared information.
Stephenson and the UH Hilo team had a big advantage: drones.
“We used UAVs a lot to decide where was safe to enter. Lava can cut off an exit quickly, so we would send up a drone to decide if a road was safe or not, or if we needed to back up and find a new road.”
The team flew on manual mode, tracking the lava through the live feed.
“Getting cut off by lava was always a concern but never became a reality,” says Stephenson. “We were cognizant of where the lava was at all times, we always had an eye on the sky with drones and we were also constantly talking to boots-on-the-ground people to make sure the lava didn’t sneak up behind us.”
Protecting communities from disaster
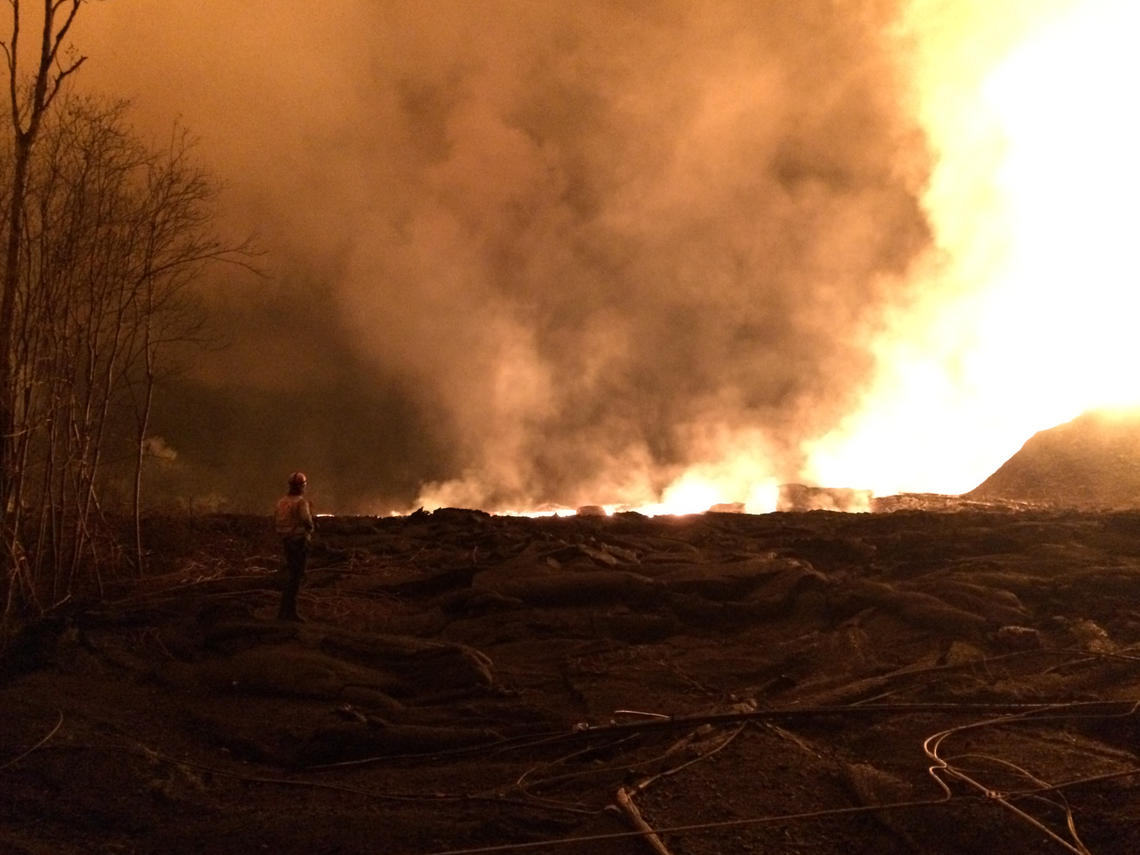
A month into the eruption event, two dozen lava fissures had erupted in almost a perfect line along Hawaii’s lower-east rift zone. Some of fissures caused a minimal amount of damage, spilling enough lava to cover two football fields before cooling. But fissure 8 began to fountain, spurting molten rock as high as 90 metres (300 feet) into the air and eventually creating a large and fast moving lava flow.

To minimize the risk to people and property, Stephenson and the UH Hilo team often headed into the what the emergency response teams called “the lava zone”.
Depending on the level of of communications infrastructure still remaining, the team might have to text the XYZ coordinates of lava movement to the Fire Department over very weak networks. In some places, “It was a radio dead zone, a cell phone dead zone - it’s very rural and the lava had knocked out some cellphone towers.”
The coordinates were transferred to digital and paper maps and the information disseminated to the wider emergency management team.
After nights of work, and fissure 8 showing no signs of slowing down, the Leilani Estates were evacuated. The area where Stephenson and the UH Hilo team had been working was eventually covered with lava.
The aftermath of the disaster
Lava from the Kilauea volcano eruption impacted hundreds of homes. What was not burned was encased in quickly hardening rock. Before the eruption officially ended on December 5, 2018, it had destroyed 716 homes, caused at least 800 million USD of damage and completely filled Hawaii's largest natural freshwater lake.
The maps created by Stephenson and the rest of the UH Hilo team couldn’t prevent the disaster, but they did help mitigate some of its effects by providing up-to-date information as the situation unfolded.