Landfill monitoring using verified elevation models
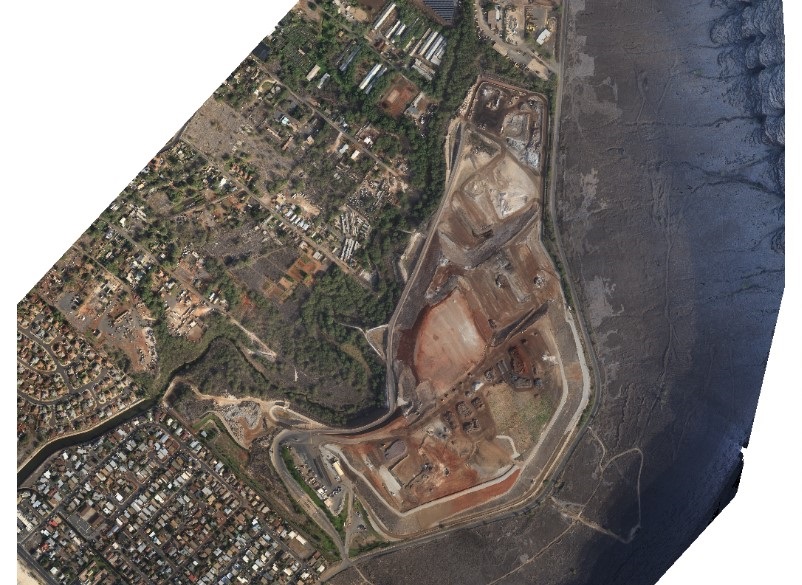
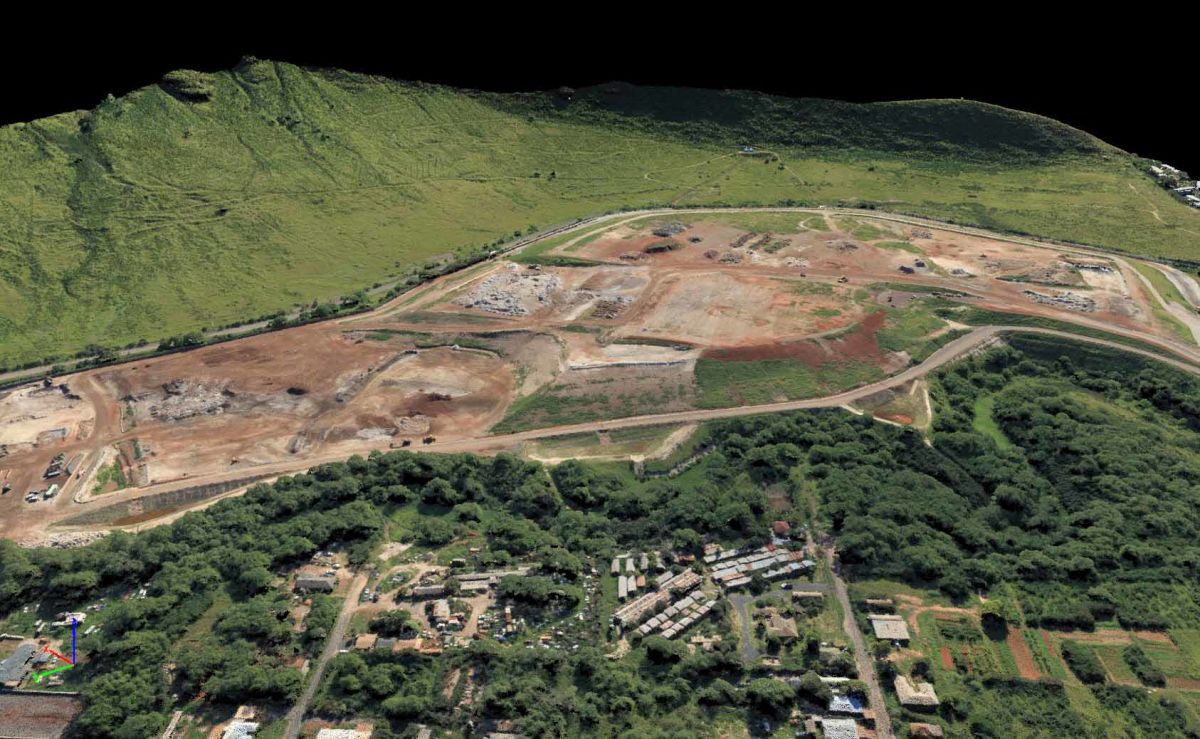
Several datasets were acquired in different months from a landfill in Hawaii in order to monitor its change over time. In this case study, three ground truth datasets were acquired using a Trimble RTK mounted on a truck.
The TerraPAC Imagery team compared the elevation of the ground truth data to the elevation of the digital surface model (DSM) generated by Pix4Dmapper to assess the quality of the reconstruction results. For each project, well-distributed ground control points were added and correctly clicked on the images.
Project details
| Company | TerraPAC Imagery |
| Country | The United States |
| Industry | Environmental monitoring |
| Project date | January 2013, May 2013, January 2014 |
| Project members | David Harrington |
| Project size | 9.8 square meters, 2.5 square meters, 6.0 square meters |
| Number of images | 1,225, 413, 303 |
| GSD | 12.1 cm, 10.18 cm, 11.27 cm |
Collecting the data
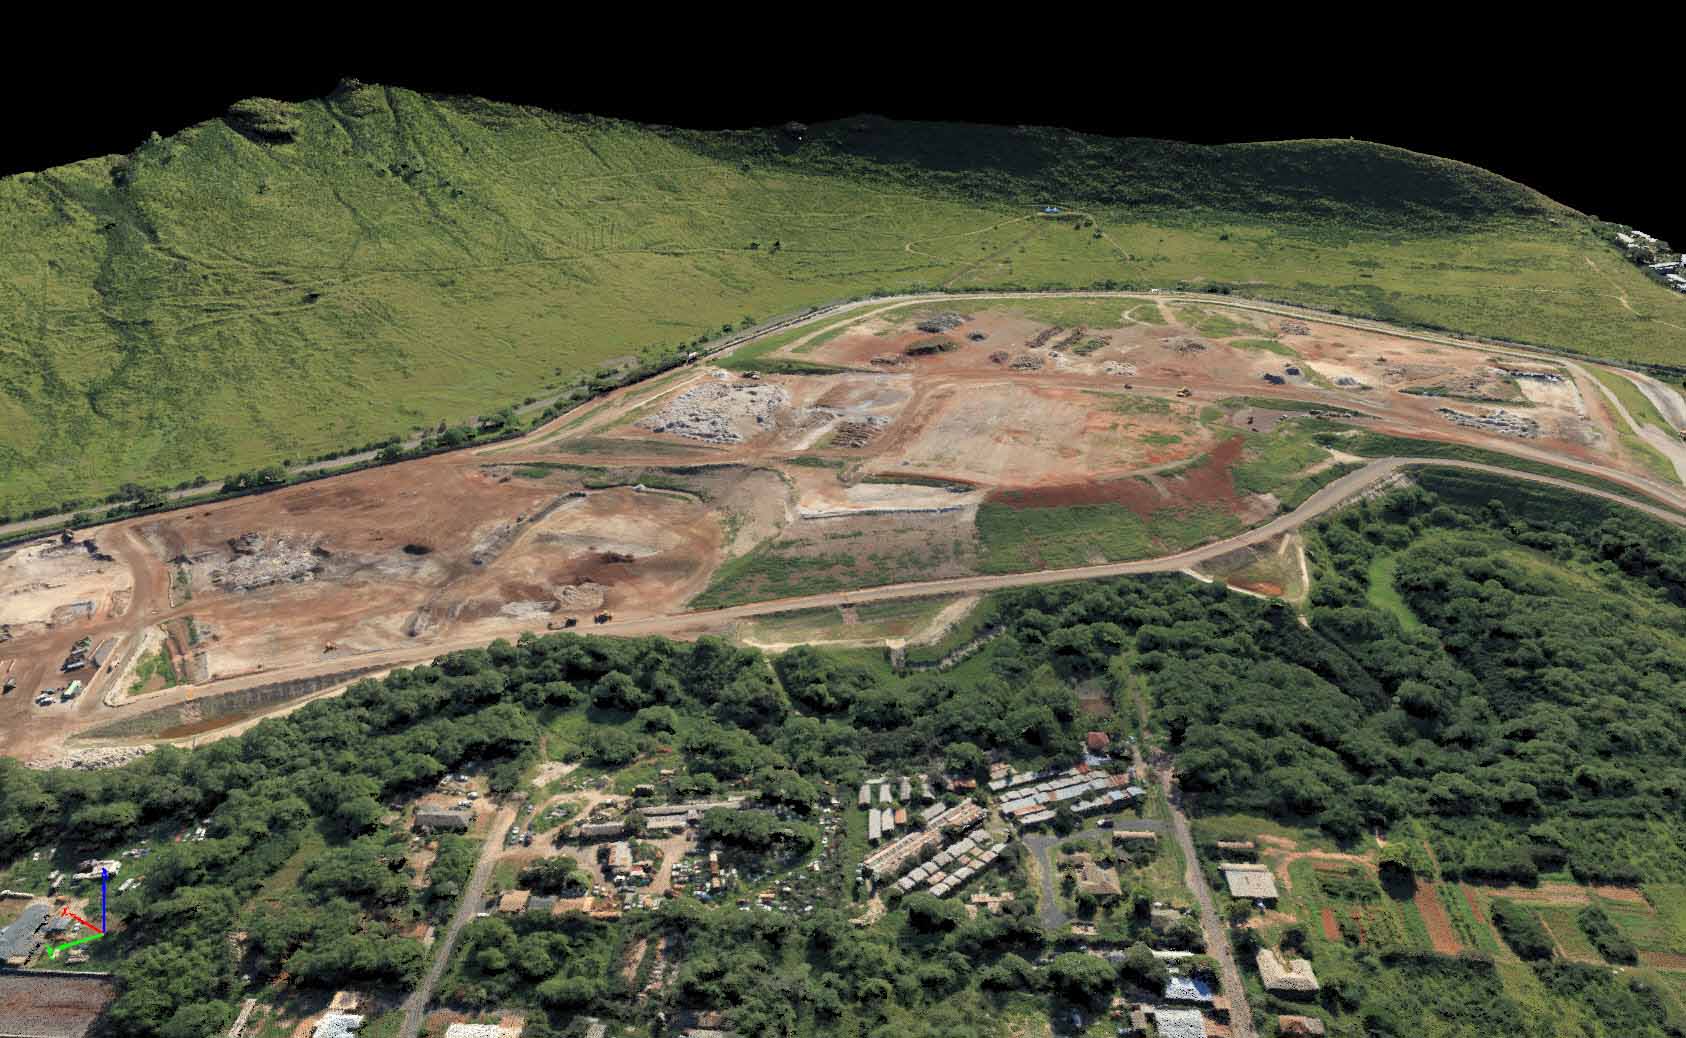
Images were taken with Canon EOS 5D Mark-II from a motor glider. Flight plan was not optimal yet sufficient overlap was achieved. For better processing results, some manual selection of the images was conducted. Three data sets covered the focused landfill were selected, they were acquired in January 2013, May 2013, and January 2014, and with 38, 28, 21 ground control points respectively.

Ground Truth Sample Points were measured with Kinematic GPS (Trimble RTK) mounted on a truck. Each ground truth survey data collection was done 24 to 48 hours after each aerial survey. Collection areas were restricted to portions of the landfill without activity. Each collection contains 7,000 to over 50,000 points distributed across the area of the landfill.
Comparing results over time
The TerraPAC Imagery team checked the Pix4Dmapper quality report in order to confirm that the results of all projects were good enough for proceeding the following comparison.
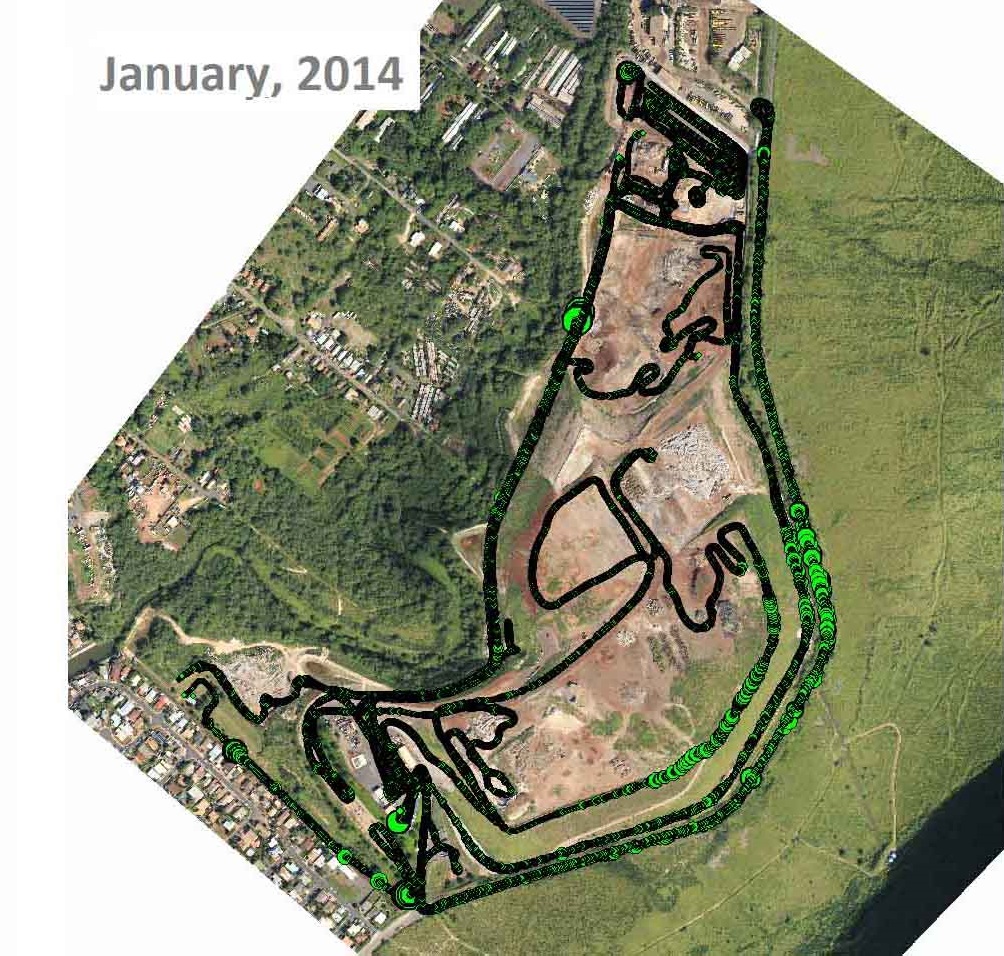
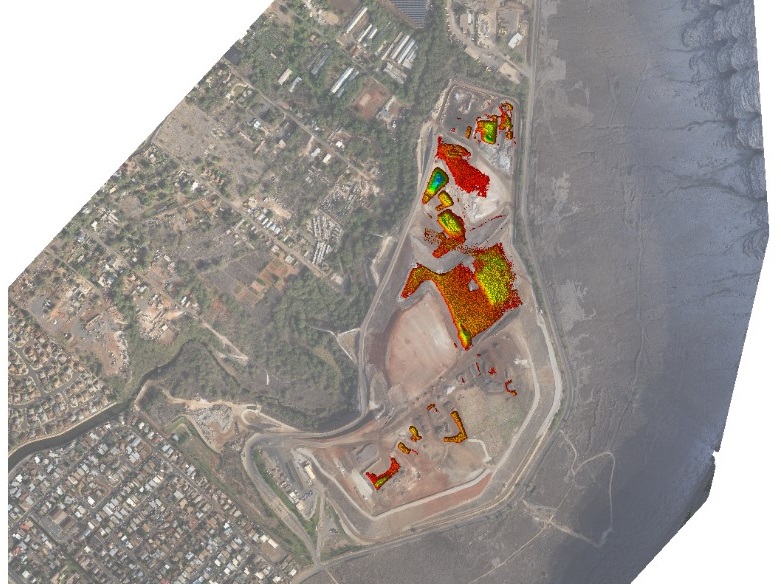
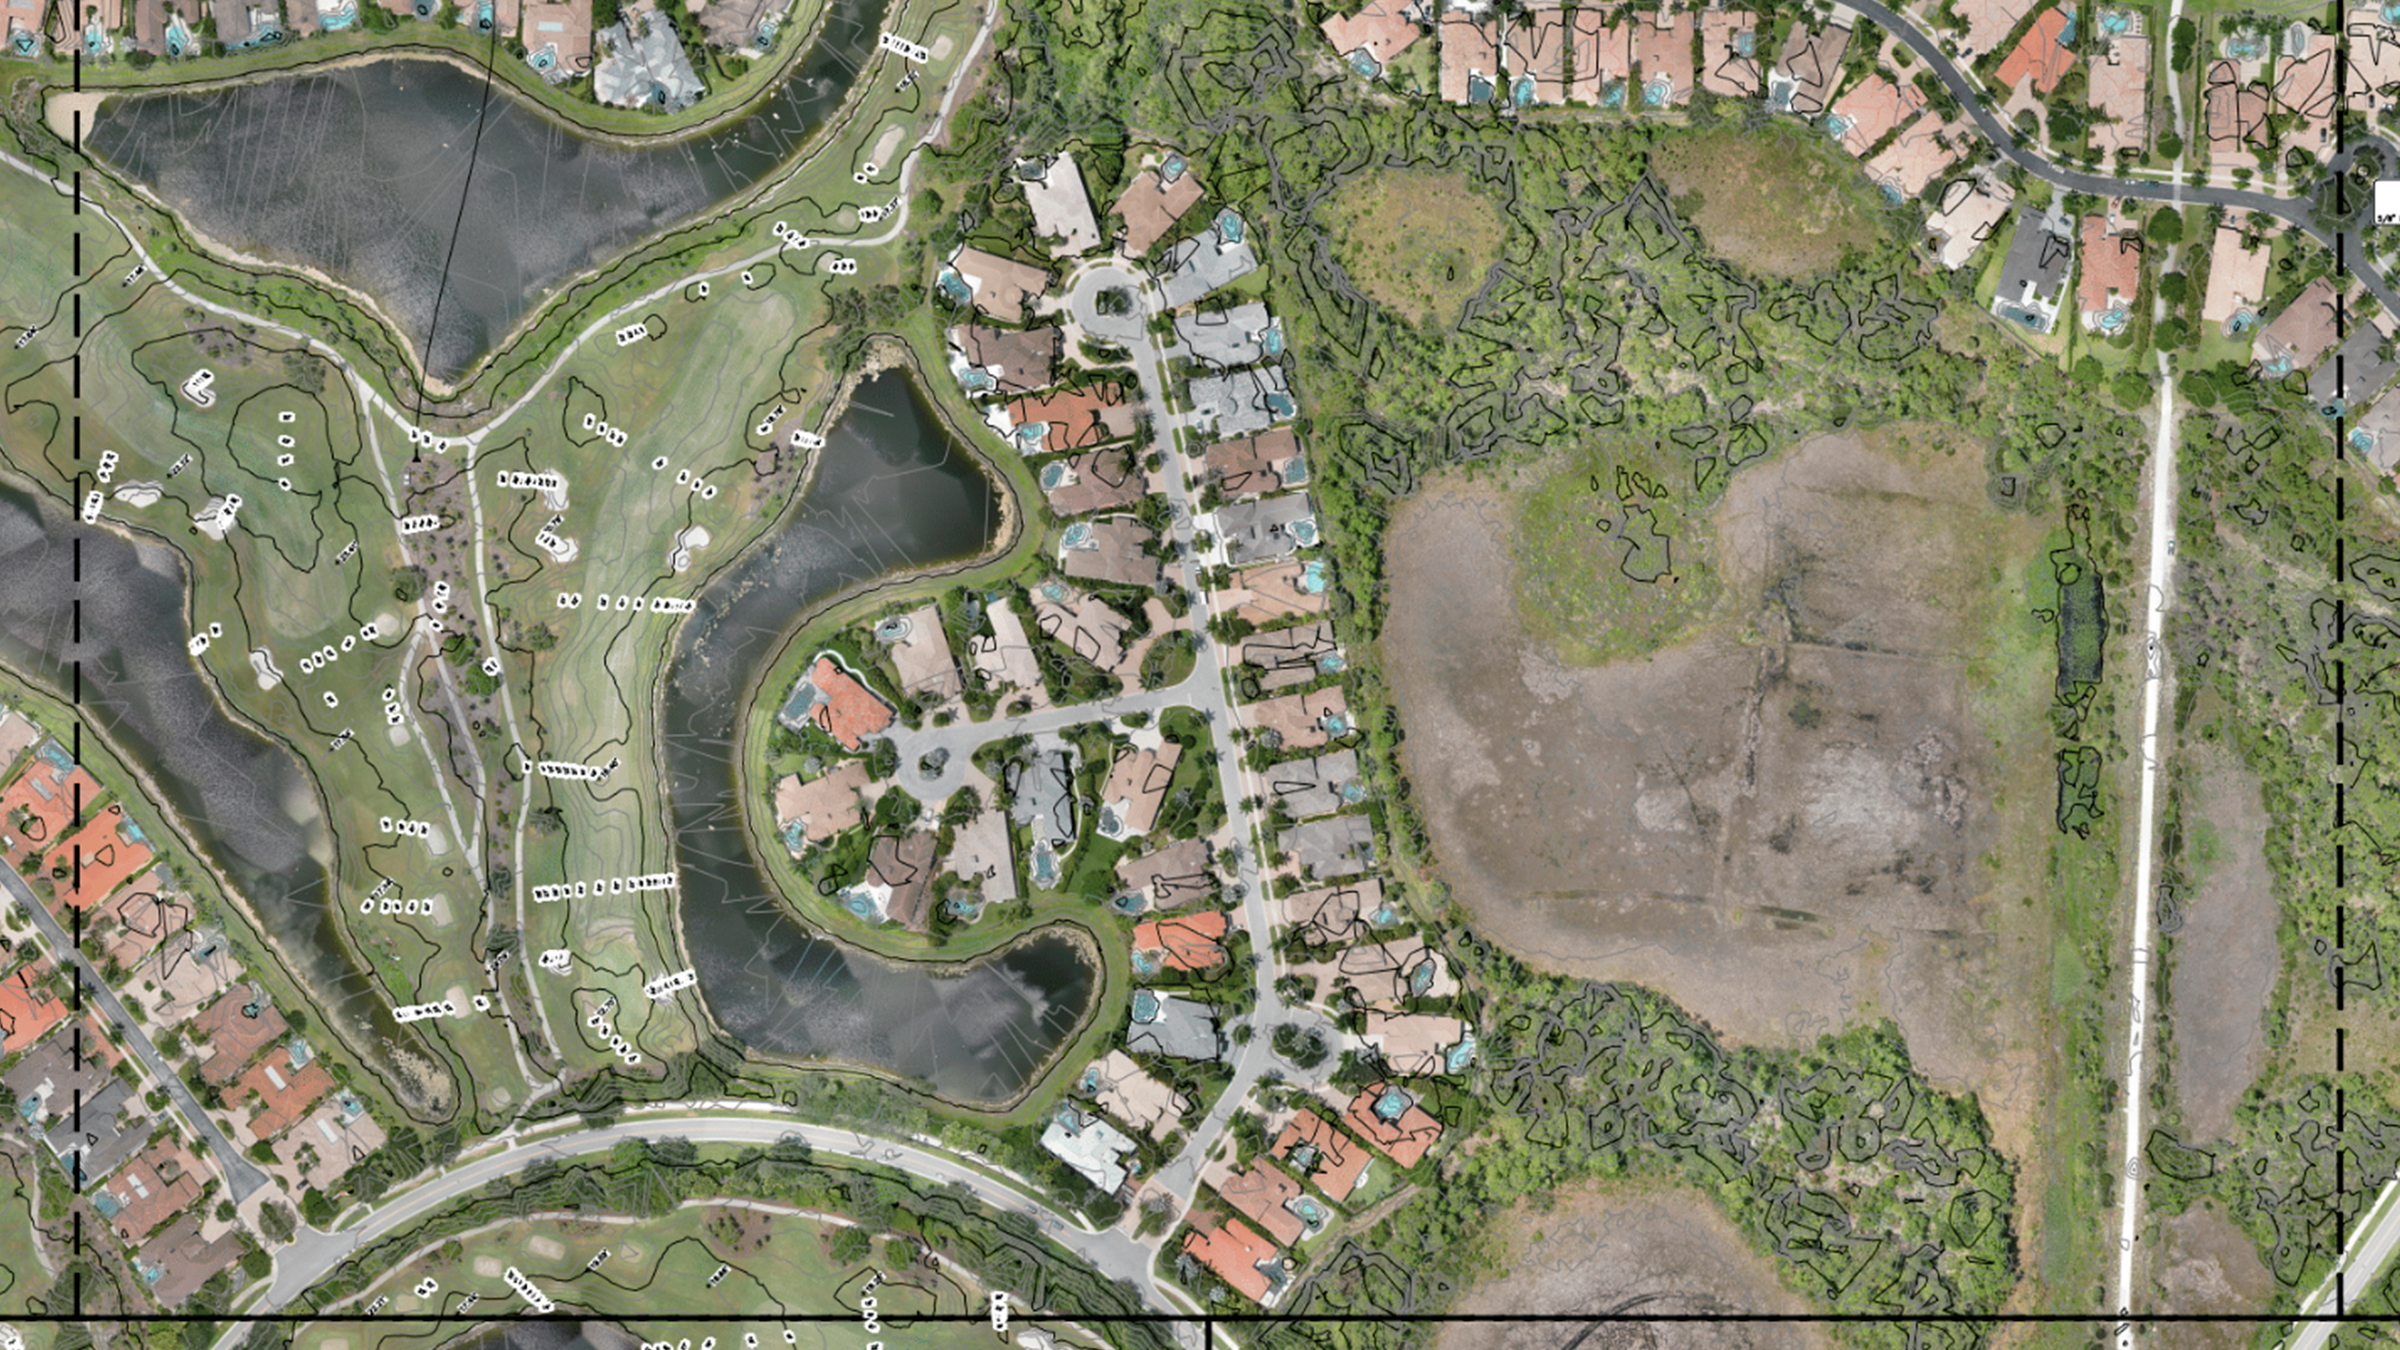
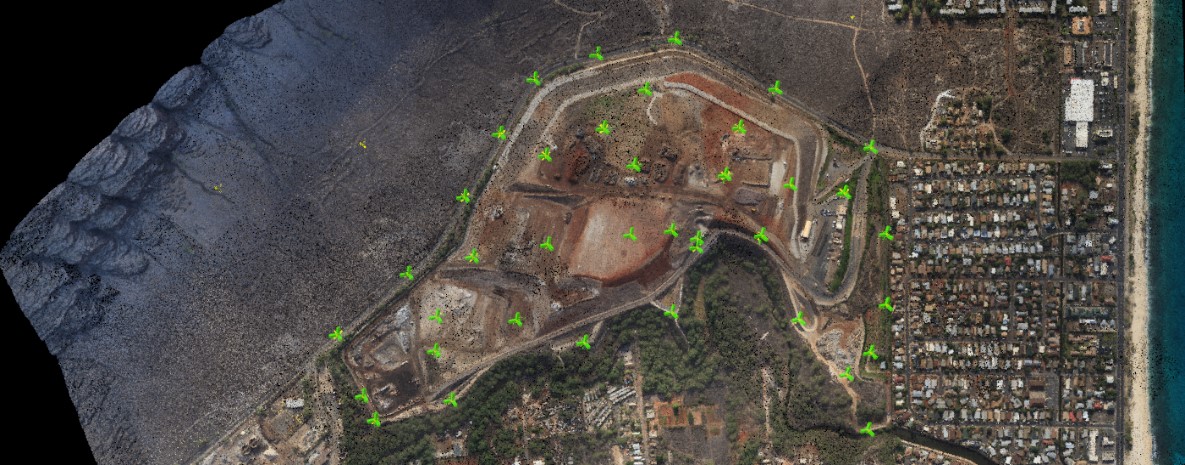
The above figures show the elevation difference between the ground truth points and the DSMs. The green points overlaid onto the orthomosaic were visually scaled according to the amount of difference, either positive or negative. Larger points indicate large discordances. The outlying points were specifically checked and were found to have been measured when the truck was passing either under a tree or over a shadow.
In these projects, the team did not remove these outliers since it is considered a common situation. Ground truth data was filtered for possible contamination of terrain slopes or gradients. The statistics did not fundamentally change, showing the truck platform is not a fundamental limit to the data accuracy.
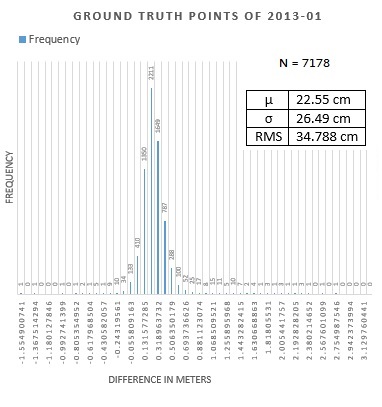
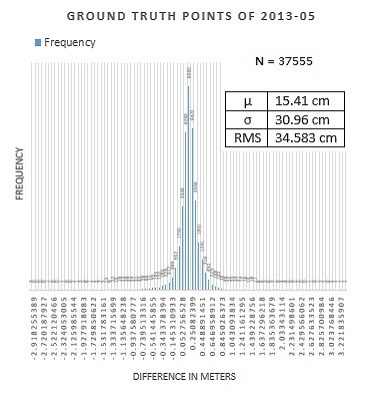
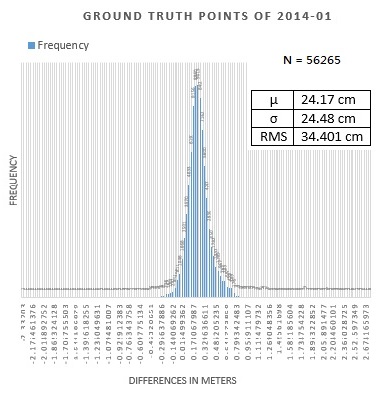
The three histograms above show the statistics results of comparing elevation difference of 7,178, 37,555, and 56,265 ground truth points and the DSM generated with Pix4Dmapper from the January 2013, May 2013, and January 2014 data sets, respectively.
These difference values come in single Gaussian distributions, which implies that there were no obvious systematic errors contained. An interesting part of the statistics is that the RMS values are nearly the same, which is approximately three times the ground sampling distance of the original images.
50% of the points are within around 20 cm of vertical accuracy, and 90% of the points are within around 40 cm of vertical accuracy
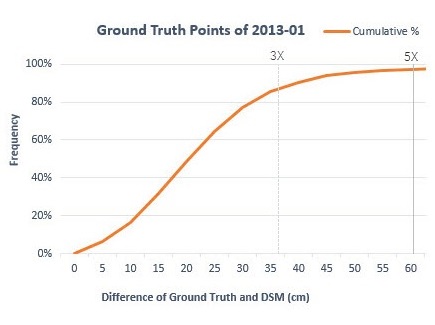
The vertical accuracy of each data set can also be displayed in cumulative frequency as shown below. From this type of analysis, we can see that for the first data set (2013-01), around 90% of the points are within a vertical error of 3xGSD, and almost 99% are within 5xGSD.
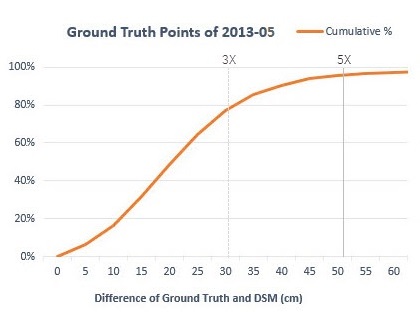
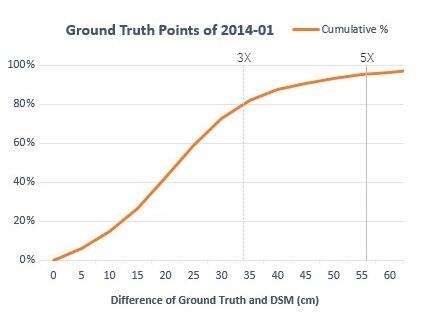
This is also the project of the best condition among the three: no removal of redundant flight lines or dark images was required. The other two data sets (2013-05 and 2014-01) have around 80% of the points within a vertical error of 3xGSD and over 95% within 5xGSD.
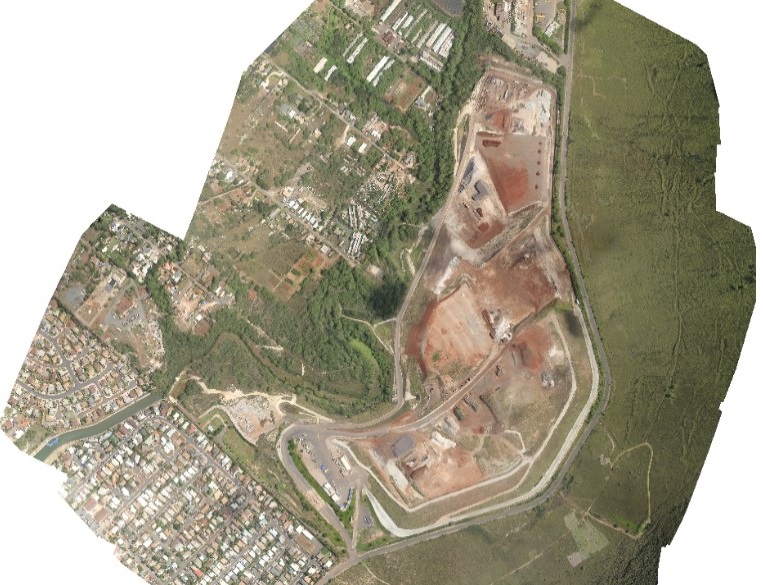
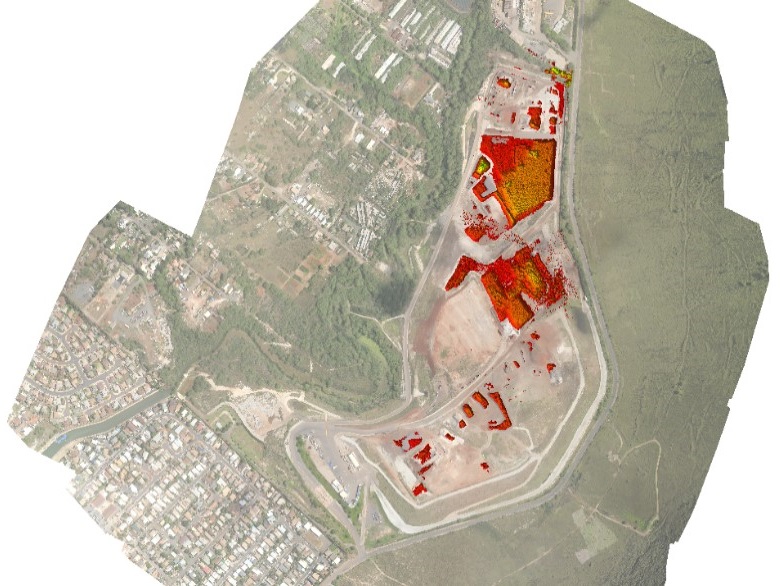
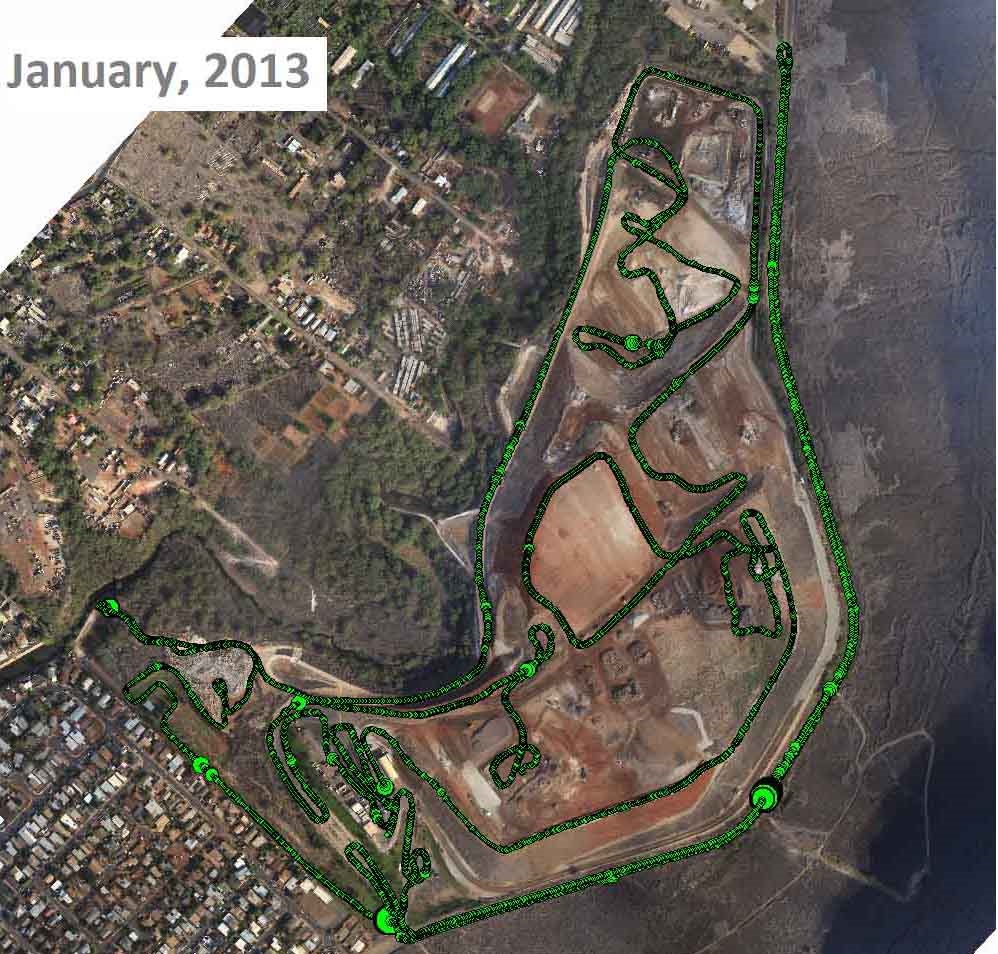
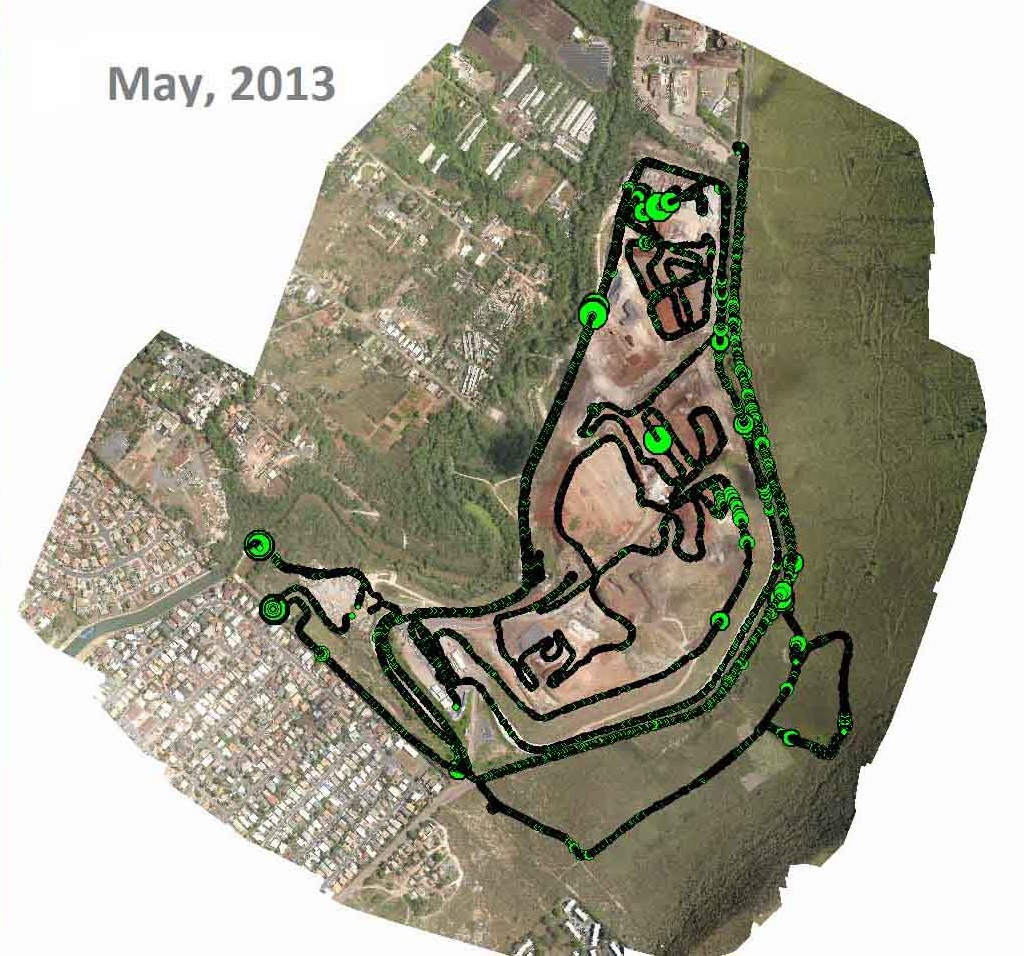
A tool for long-term monitoring
These results also allow the team to monitor the change of this landfill over time. From the figures below, the team compared the elevation difference of the two sets, only focusing on the landfill region – (a) January, 2013 (reference) and May, 2013 and (b) May, 2013 (reference) and January, 2014, and we overlaid the difference on the orthomosaic of the referenced data set. In the results, we can then know the position and approximate volume of change.