Do more GCPs equal more accurate drone maps?
The Nevada Department of Transportation is responsible for the planning, construction, operation and maintenance of 5,400 miles of highway and over 1,000 bridges which keep the state of Nevada moving.
Like many innovative government departments, the DOT uses drones for mapping. Because accuracy is vital, the team uses ground control points (GCPs) as a standard part of their workflow. But placing GCPs adds a lot of time, and the team had heard that in some cases GCPs may not be necessary at all. For example, RTK drones can give extremely accurate results without using any GCPs.
To test how many GCPs are really required for accurate results, the team set out a series of tests.
Project information
| Location | Nevada, USA |
| Team members | Jason Rolfe |
| Hardware | DJI Phantom 4 Pro |
| Software | Pix4Dmapper photogrammetry software |
| Area | 34 acres |
| GSD | 1.93cm |
| Images captured | 318 |
Testing the ideal GCP density
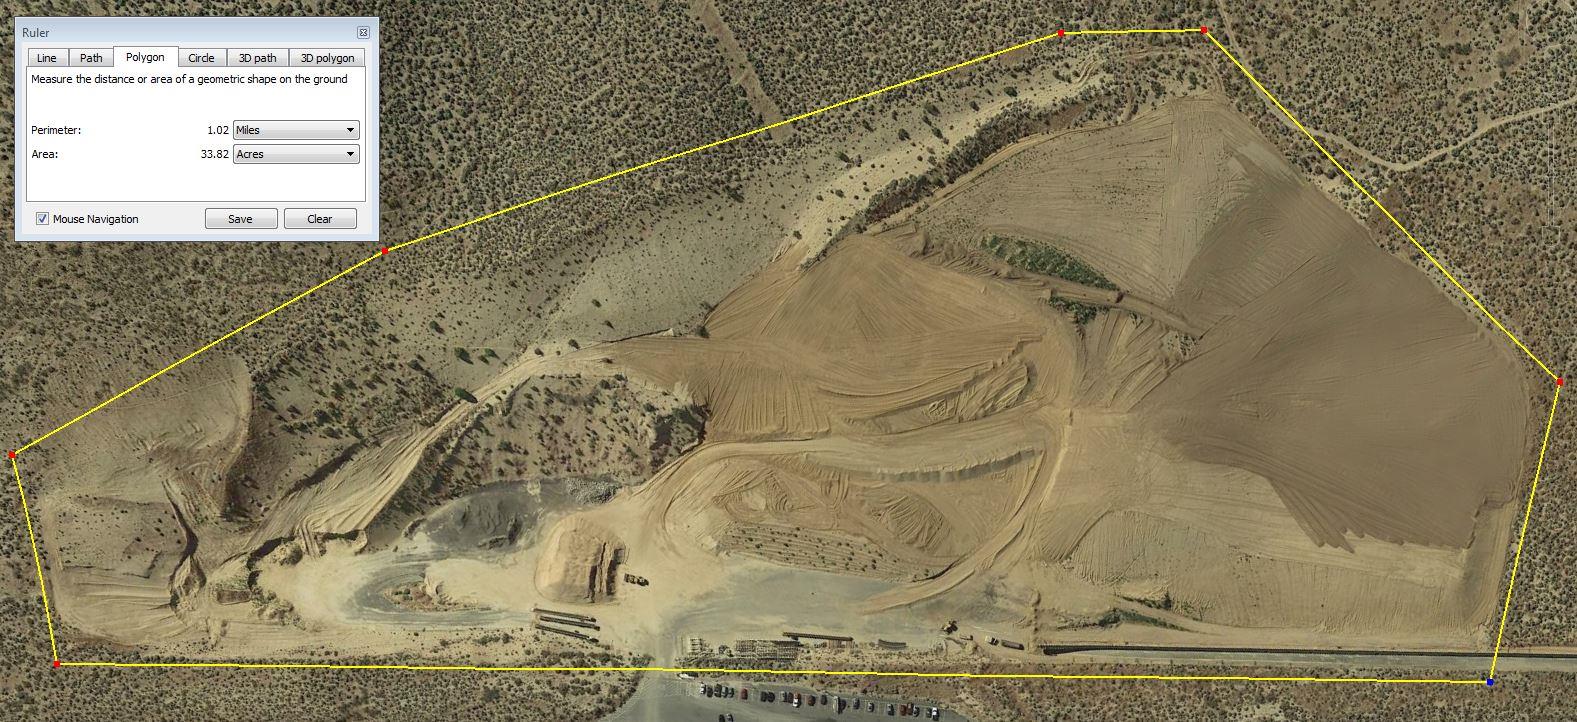
An active Nevada Department of Transportation quarry was selected as the test site. The 34 acre site measures approximately 2,000 feet long and 900 feet wide. There is approximately 180 feet of vertical relief between the highest and lowest ground control shots. The site is bordered to the southeast by Highway 50, and to the remaining sides by undeveloped sagebrush habitat.
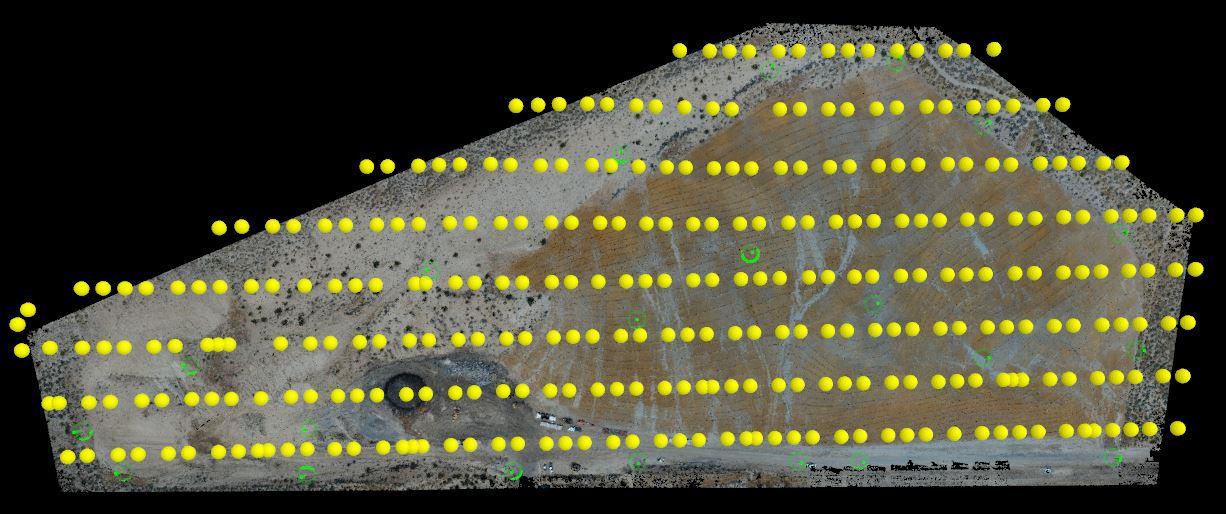
21 ground control points were arranged throughout the project site and surveyed using a Trimble R10 RTK rover connected to a VRS system over cellular radio.
The imagery was collected using a DJI Phantom 4 Pro, processed in Pix4Dmapper photogrammetry software, and point cloud products were georeferenced using 0 to 18 GCPs. GCPs that were not used to georeference the project were used as check points to compare the reconstruction to the real-world values.
In total, over 15 computations were created and their root mean squared error (RMSE) values were compared. The configuration of the GCPs were varied in order to observe the change in accuracy, and to compare the point cloud with respect to GCP density and location.
Drone mapping methodology
The 34-acre site was surveyed using a DJI Phantom 4 Pro at an average elevation of 200 feet above the ground level (AGL). Altitude was adjusted to terrain elevation allowing for a more consistent ground sampling distance (GSD).
In total, 318 images were captured using the drone’s 20-megapixel camera and resulted in an average GSD of 0.76ft/1.93cm. Imagery was acquired with approximately 80% forward and 70% side overlap. Pix4Dmapper was used for processing and to perform accuracy measurements.
Site-specific survey methods
The site was georeferenced based on six monuments and the survey points were converted to State Plain coordinates (NAD83 Nevada West) in US Feet. The aerial targets were surveyed using a Trimble R10 RTK rover using a cellular modem to connect to a Virtual Reference Station.
Ground control points vs. check points
To ensure their results were accurate, the NDOT team used both ground control points and check shots.
While GCPs and check points do not differ in how they were marked or surveyed in the field, their use in Pix4Dmapper has distinct consequences for the accuracy of the reconstruction.
GCPs are interpreted by Pix4Dmapper as concrete anchor points that the project must be adjusted to. When the points are imported into the software, the user enters the precision of the surveyed points, which gives the program a certain amount of “wiggle room” in which to do a best fit for the data. GCPs are used by the software to establish the coordinates of the model and affect the accuracies of the final product.
Check points are also entered into the mapping software, but they are not used during the computation: they are only used to compare the reconstruction to real world readings.
Accuracy analysis
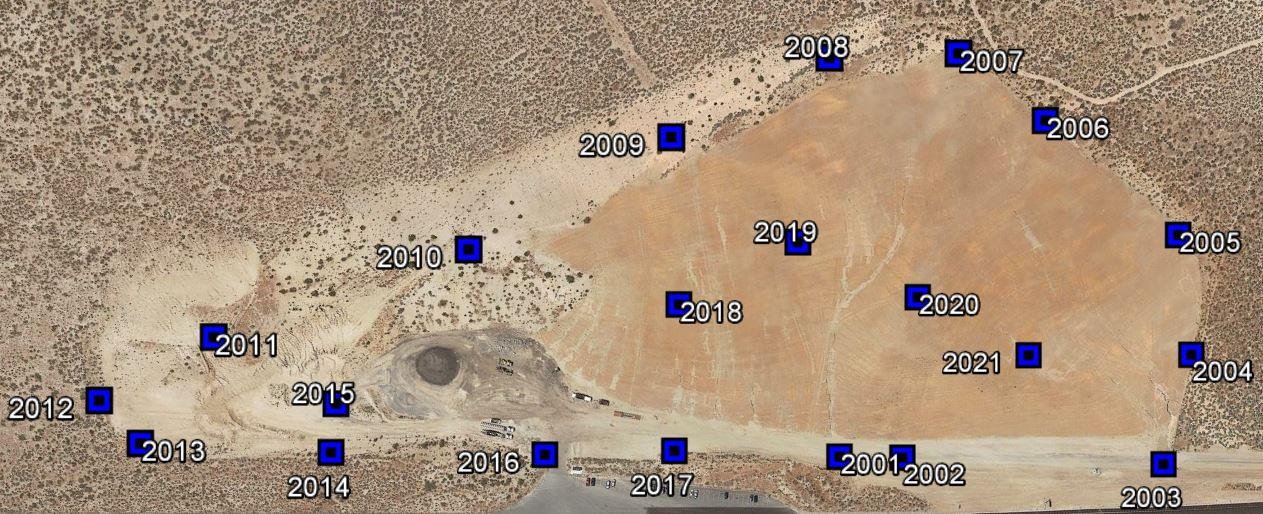
To find how many GCPs are required for accurate results, 21 ground control points were placed throughout the quarry. These were incrementally removed in the processing step and turned into check shots.
As can be expected, the vertical component is the most sensitive to change and will be the focus of this discussion.
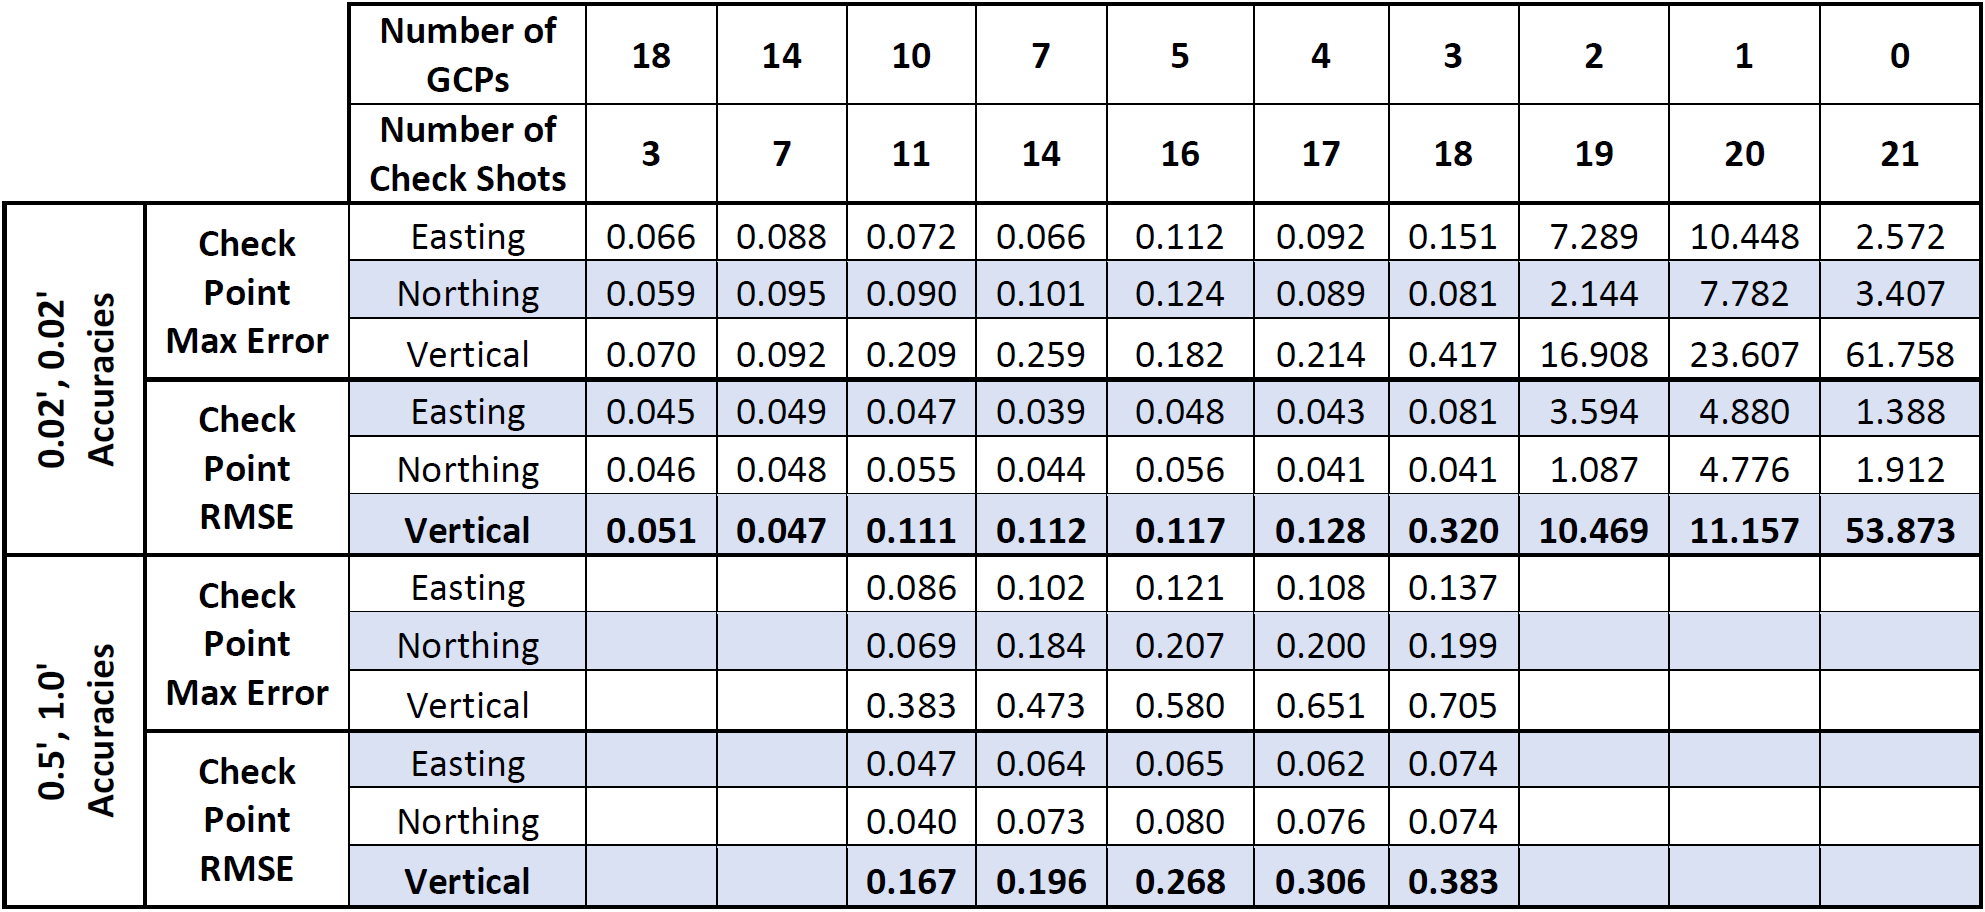
The vertical RMSE was about 0.05 feet from 18 to 14 GCPs and was consistently around 0.1 feet from 10 to 4 GCPs. With less than 4 GCPs, the RMSE degrades because the accuracy of the on-board GPS isn't very robust. Surprisingly, it took only about 4 GCPs for a reasonably accurate survey.Table 1 is using the same GCP configuration, but Pix4D was told that the precision of the GCPs was lower, allowing the program to move the project around a great deal more. This shows that the entered accuracy of the ground control and check points has an effect on the reconstruction, which is to be expected.
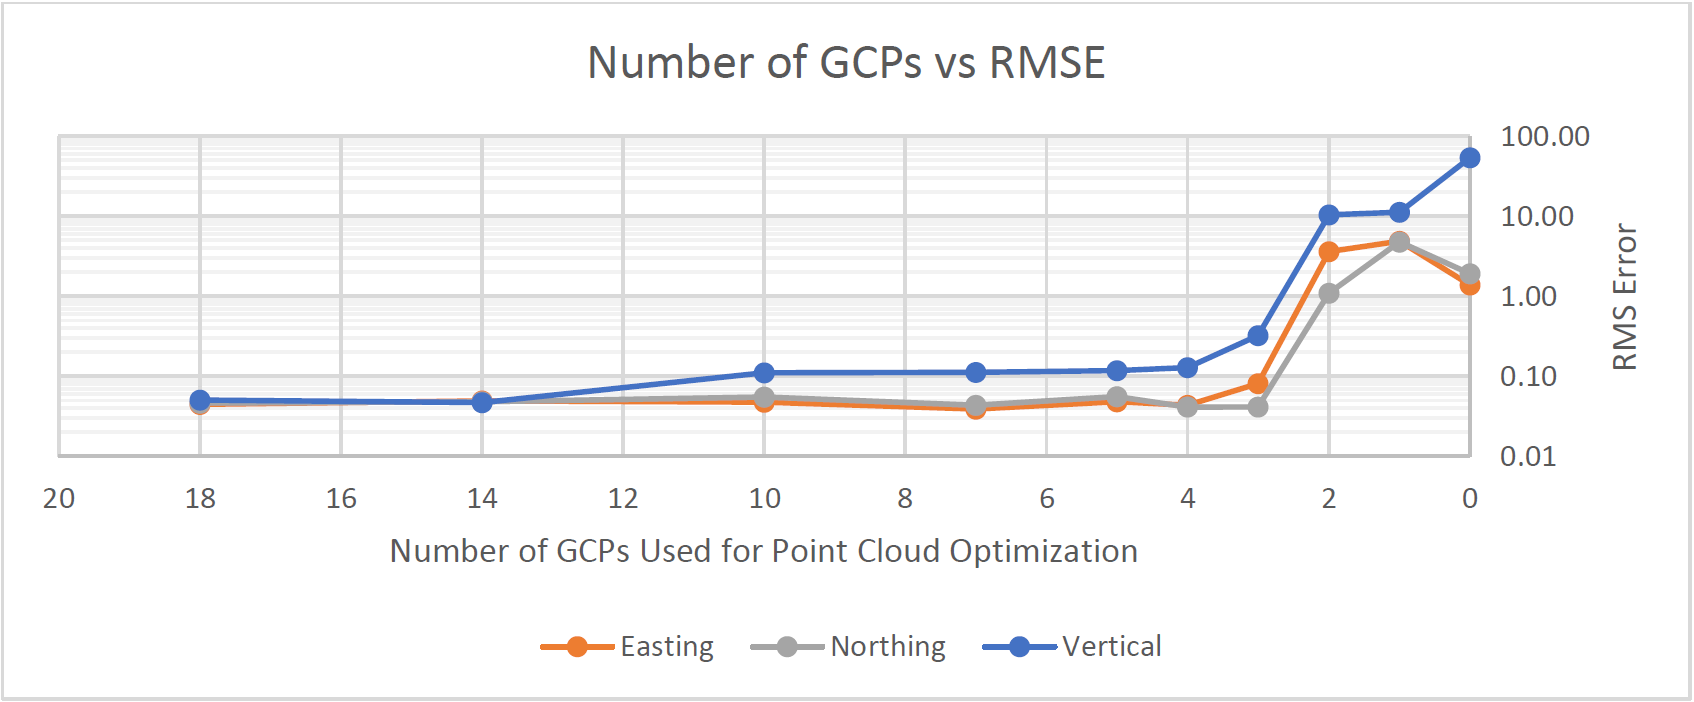
Figure 4 represents the survey’s RMS error versus the number of ground control points used, but is provided in a lined graphic. While the horizontal and vertical remain similar throughout the study and the vertical starts to degrade at a faster rate.
Ground sampling distance and root mean square errors
Pix4Dmapper relies on picking individual pixels from the aerial imagery and creating a network of points that can be recognized from image to image. As such, the final accuracy of the reconstruction can never exceed the resolution, or Ground Sampling Distance (GSD), of the original images.
According to calculations performed in Pix4D, the GSD of the test data is approximately 1.9 cm or 0.75 inches per pixel.
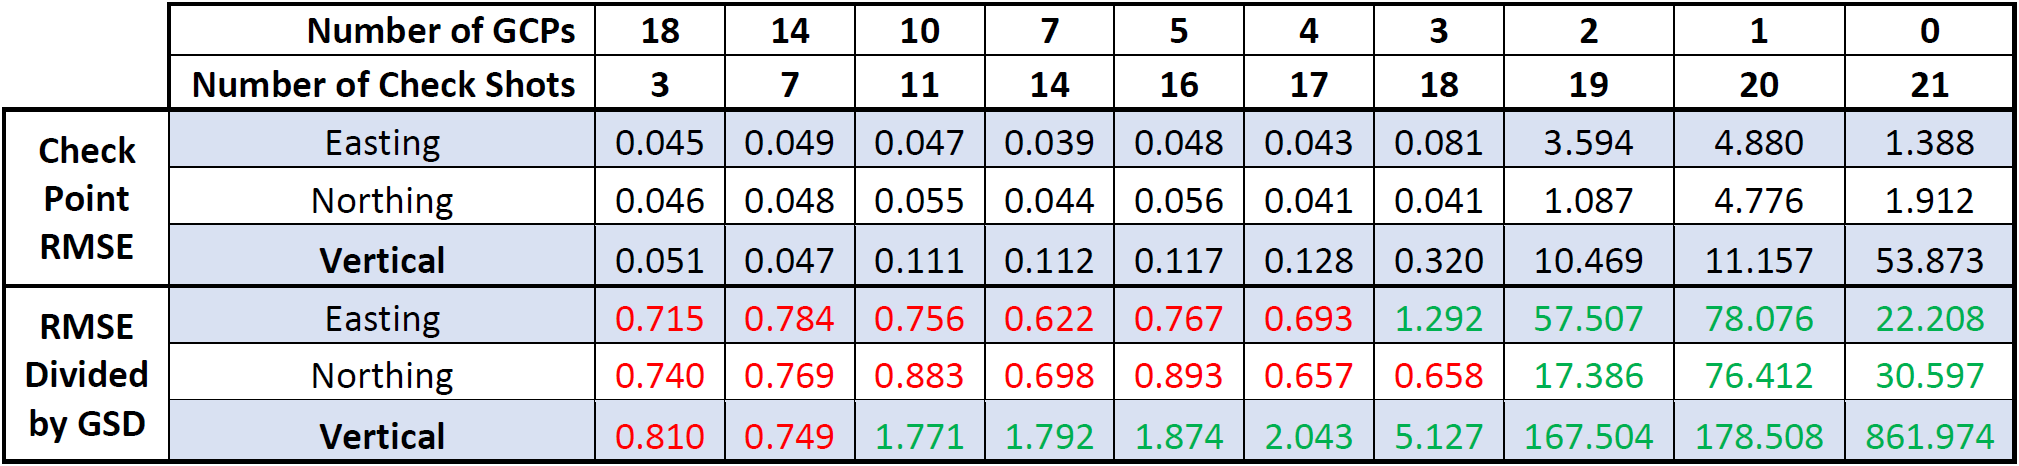
In this table the relationship between the GSD and RMSE can be seen and is colored red where the RMSE is below the GSD or green where the values are greater than the GSD.
For these kind of projects, the accuracy cannot be lower than the ground sampling distance because of the method for picking the targets in the Pix4D referencing process. Effectively, this means that 11-13 GCPs would likely be the most efficient number for this site and geometry.Accuracy outside of a controlled block
Point cloud data that lies outside of a controlled region is generally considered to be unreliable, but how far outside of that boundary do you have to go before the accuracies become grossly unusable?
If your controlled block happened to omit an area that you wanted topographic information for, could you trust it if it was 10, 100, or 1,000 feet from your original area of interest? This may happen if you don’t have ground-level access to a site, if the area was too dangerous to reach on foot, or if the area of interest changes after the data has been collected.
Figure 5 shows the relative elevation change across the site from the low end on the far east to the highest point at the north-northwest.
In Figures 6 through 9, the GCPs have been arranged to assess check points that lie outside of the controlled block. The vertical difference between the measured values and Pix4D derived values are shown in blue and scale bars have been added. Note that the grids measure 200 by 200 feet. The lowest differences are along the bottom trending shots, which are on a reasonably flat road. Total vertical relief for the lowest and highest surveyed points is about 180 feet, as shown below.
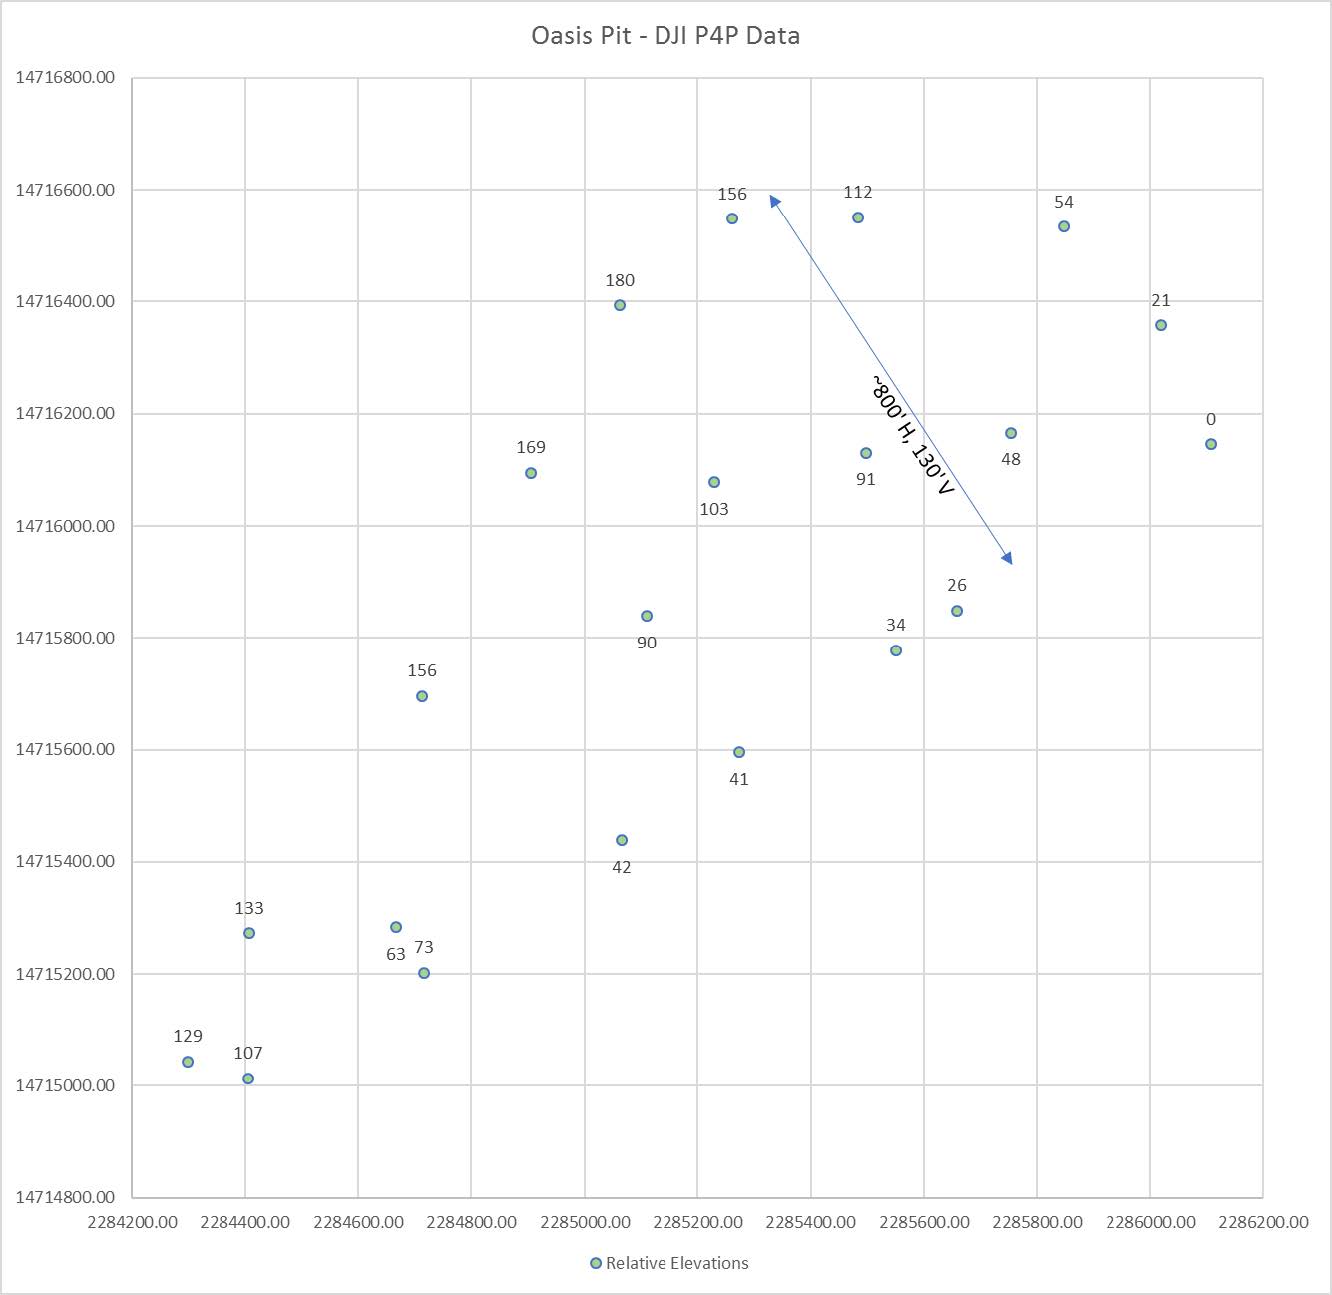
The relative elevations are shown in Figure 5, with the lowest portion set to 0 feet. The highest point is along the top side of the quarry with a relative elevation difference of 180 feet.
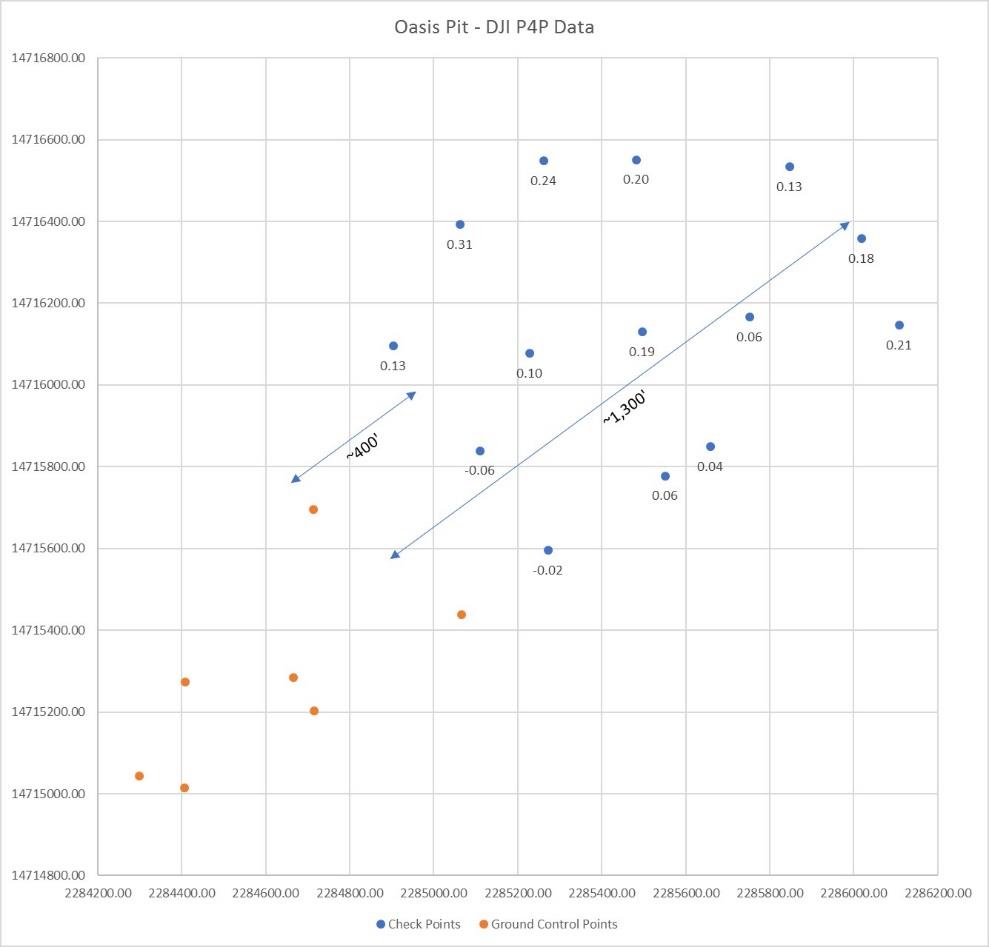
In Figure 6, the maximum horizontal extent from the controlled block to the farthest check point is approximately 1,300 feet. The site has approximately 180 vertical feet difference between the lowest and highest check point/GCP, which increases from the southeast to the northwest. The highest vertical difference between the check points and Pix4D derived values is 0.31 feet, which lies near the top of the quarry. In general, the vertical differences tend to increase with horizontal distance and with changes in vertical relief.
Surprisingly, the values are reasonably low for the distances involved and may be considered useful for most topographic mapping projects. The overall vertical RMSE for this configuration is 0.16 feet.
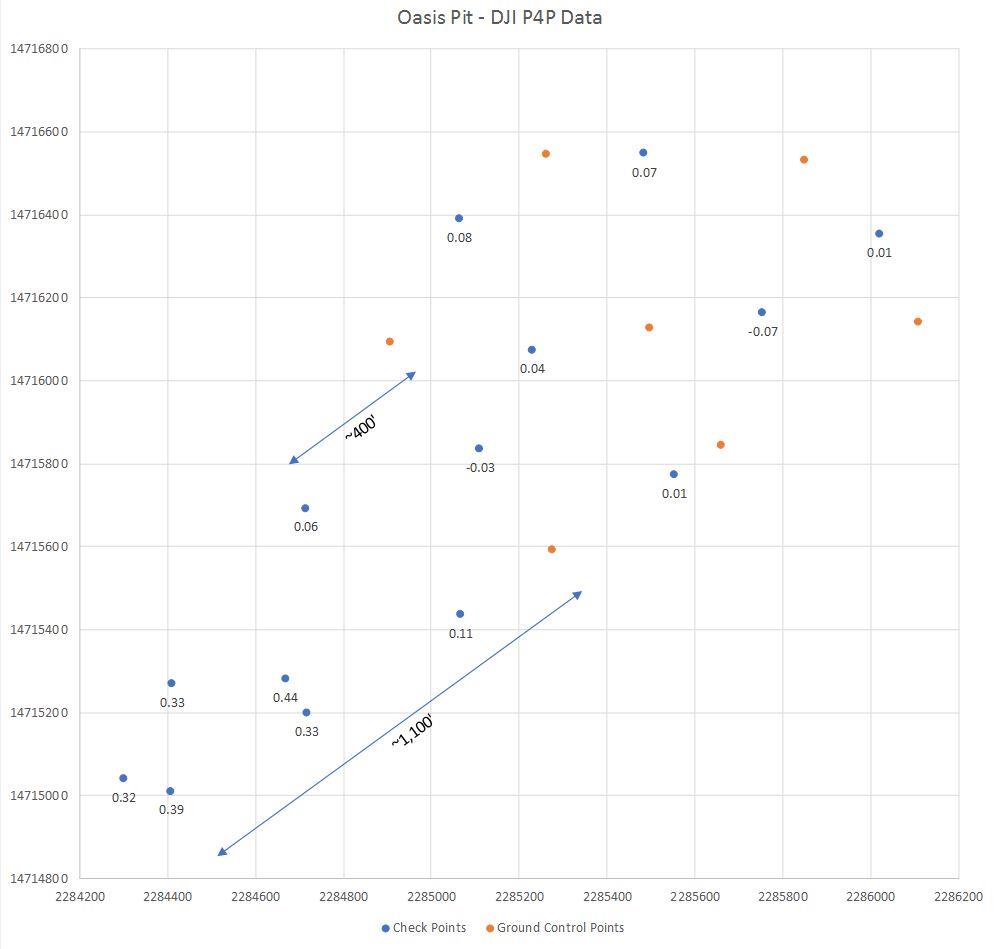
In Figure 7, seven GCPs are used on the east side of the project and the vertical RMSE values are displayed for the remaining 14 check points. As you can see, the check points within the controlled area are accurate to a tenth of a foot and the vertical change increases the farther you get from the controlled area. The highest maximum vertical difference (0.44 feet) in this example is higher than the previous example, but would still prove to be useful for general topographic mapping and modeling purposes. The overall vertical RMSE for this configuration is 0.22 feet.
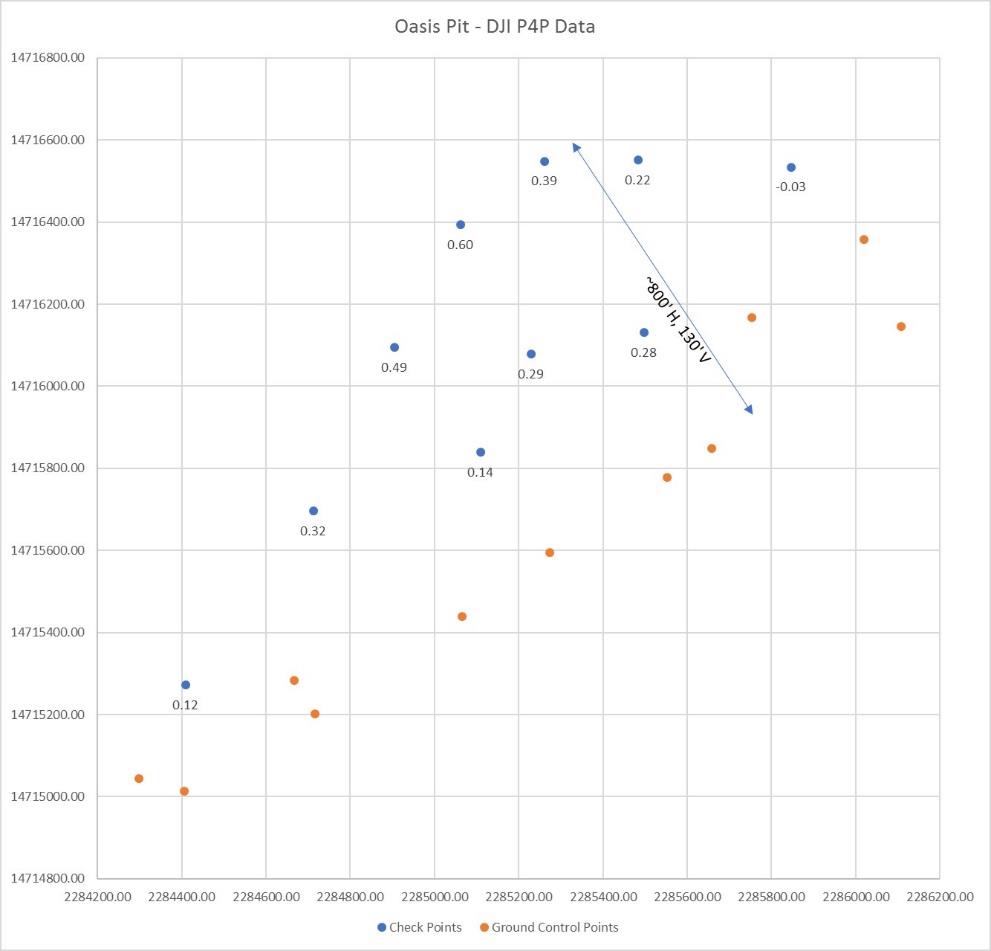
In Figure 8, the ground control points have been arranged in a narrow, linear pattern along the vertically lower side of the project. As indicated, the blue arrow in the figure shows both the horizontal and vertical changes along that line. The maximum difference in this model is 0.60’ and occurs near the top of the quarry and the general trend is a decrease in accuracy as the vertical relief increases. It should be noted that the configuration of the GCPs in this example is far less than ideal, but could happen where site access is limited to a road corridor or other narrow layout. The overall vertical RMSE for this configuration is 0.33 feet.
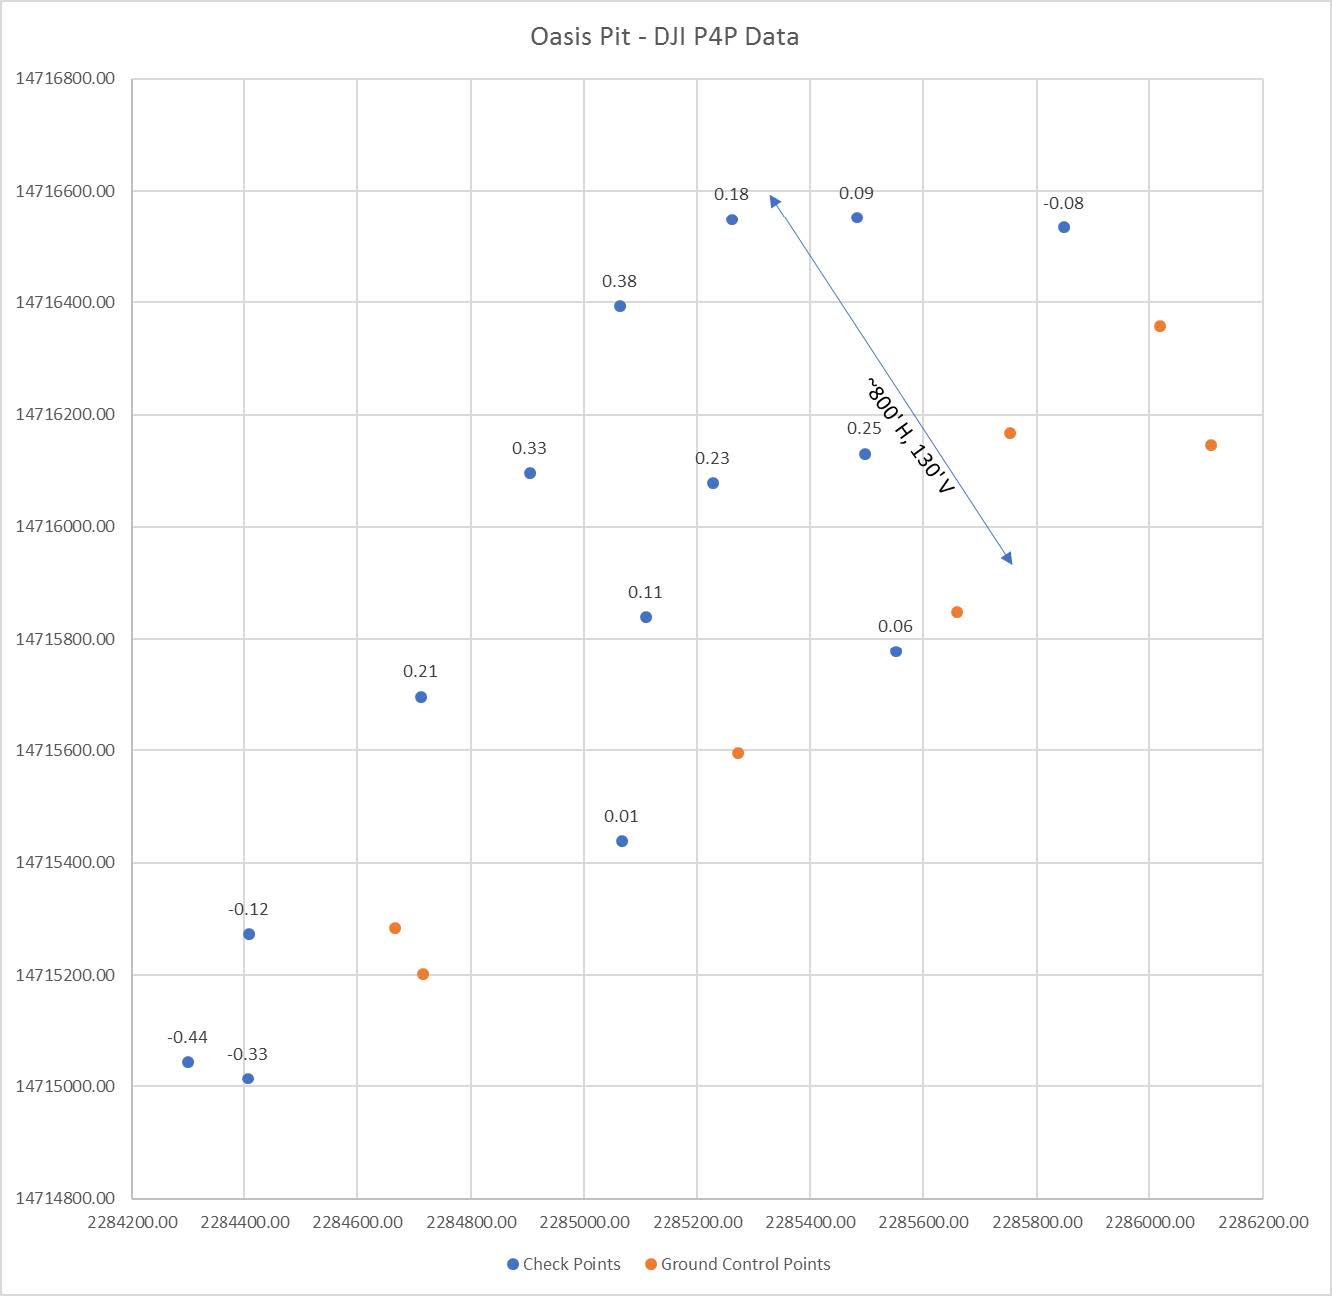
Figure 9 is similar to the previous example, except that the number of GCPs has been reduced by 4 to a total of 7. Surprisingly, the maximum vertical difference is 0.44 feet and the vertical RMSE is 0.24 feet, indicating that the model may be more accurate than the previous configuration that used more GCPs. As previously seen, the largest vertical errors tend to occur where there are large vertical changes, such as the far southwestern corner of this example.
More GCPs do not mean more accuracy
The configuration, number, and location of the ground control points ultimately controls the accuracy of the reconstruction, but there is little to gain by adding too many. Pix4D recommends using approximately 5 to 10 GCPs and indicates that “more GCPs do not contribute significantly to increasing the accuracy.”
The results of the tests (shown in Table 1) agree with the notion that there is a limit to how many GCPs can be added before there is a negligible increase in accuracy. The time needed to place, survey, and register the aerial targets appears to have a negative return on time investment, especially when you consider that the minute increases in accuracy may be lower than the actual ground sampling distance (Table 2).It also appears possible to extrapolate 3D data beyond the controlled area of a survey, with reasonable results. Of course, this is not recommended when accuracy is paramount, because the data can only be assumed to be reasonable, and there are no check points with which to verify the reconstruction. This may be an effective tool to use if ground control cannot be placed due to worker safety, land ownership difficulties, or changes in the area of interest after data collection. Point cloud accuracies seem to be especially sensitive to vertical changes in topographic relief, although large (> 1 foot) variations in the reconstruction were not observed.
In summary, ground control points are necessary for precision mapping products and their layout must be considered a vital part of drone or UAV mission planning. Check points should be acquired and play an important role in the accuracy assessment report. The integration of these crucial elements will help create an accurate reconstruction that can be measured and verified for the end-user.